Don't take trading claims
on trust. Test them.
Learn the tools, put them on real charts, build rules without code, and see what the data actually shows. Charts, indicators, visual strategy building, backtesting and event analysis in one place.
- 48lessons
- 60+indicators
- 22practice scenarios
- 400+US stocks & ETFs
Learn → Explore → Build → Test → Investigate
Understand indicators, patterns and market concepts.
Put them on historical charts and see how they behave.
Turn an idea into visual rules without writing code.
Backtest those rules and inspect what happened.
Define a market condition and examine what tends to happen around it.
What you actually get.
Click any image to see it full size.
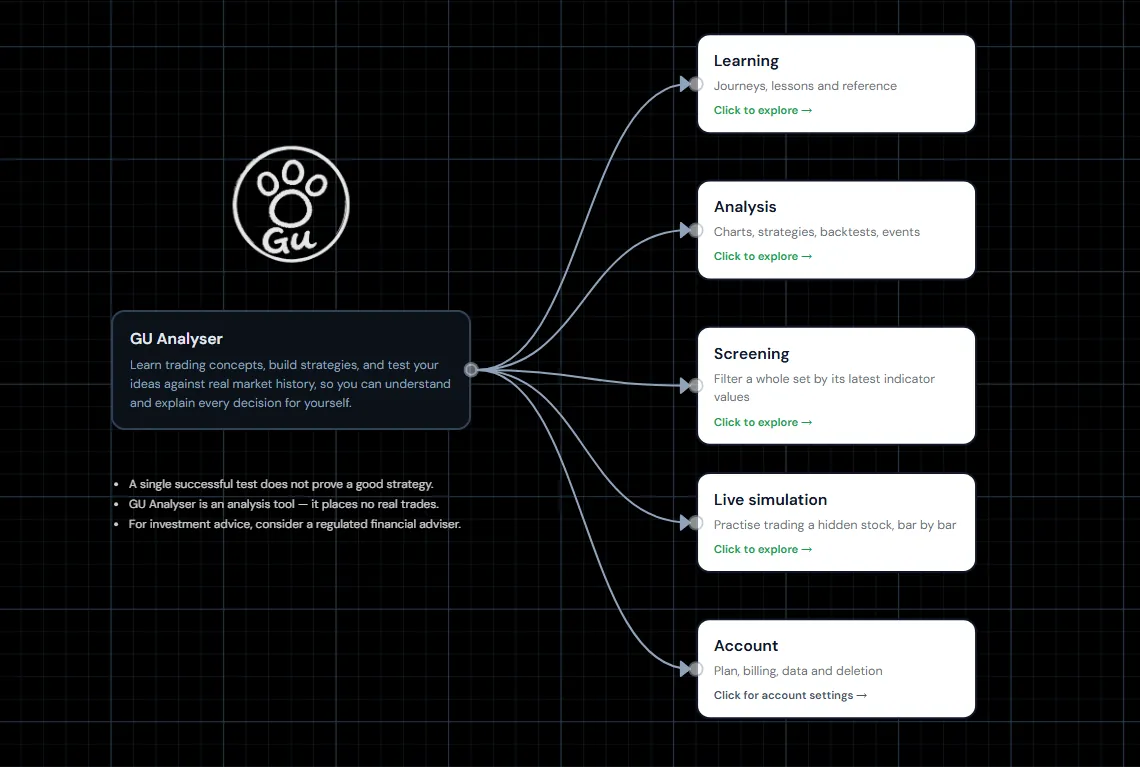
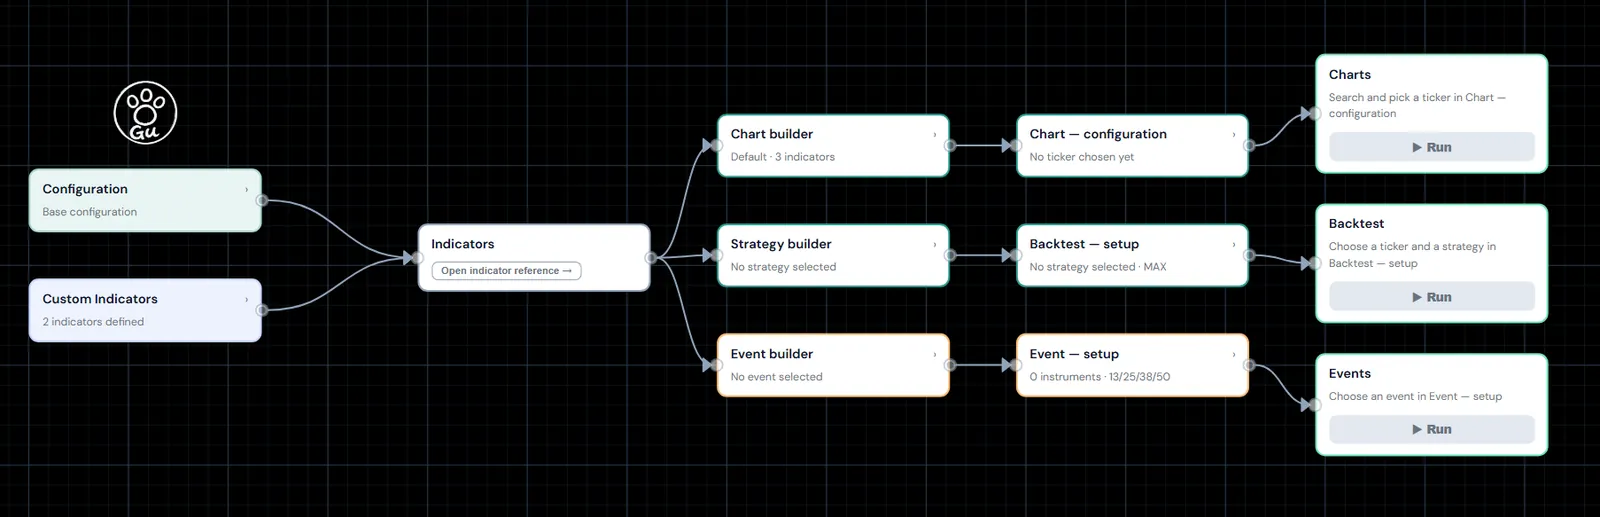
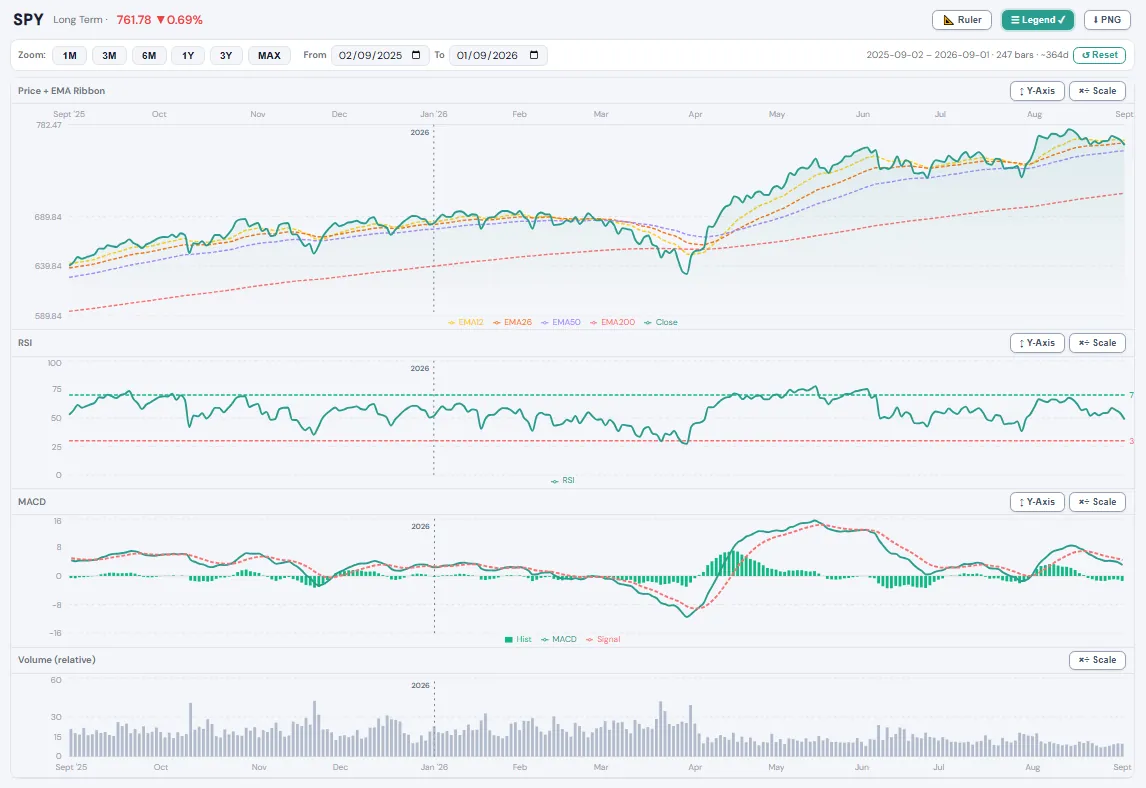
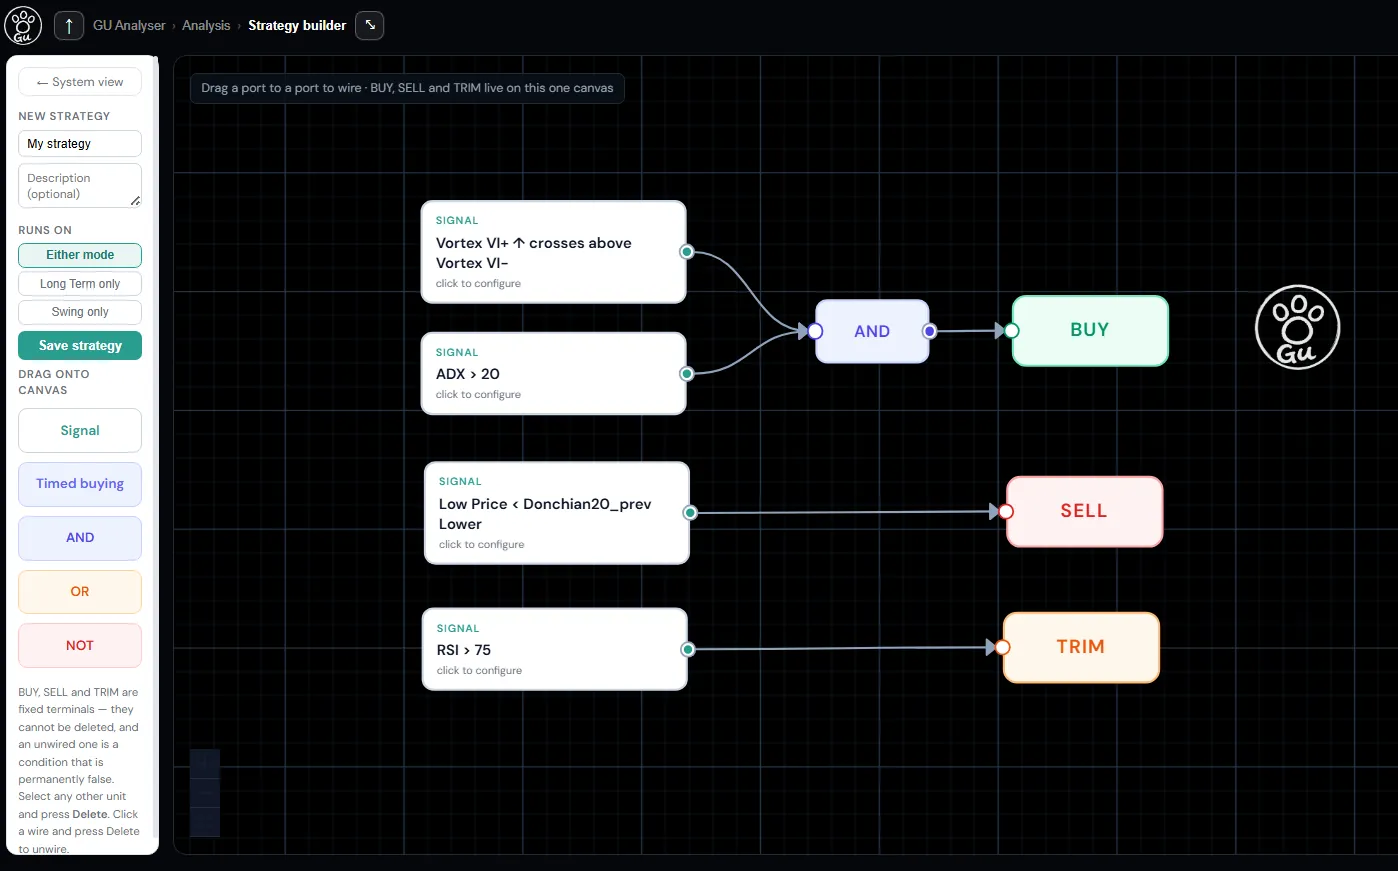
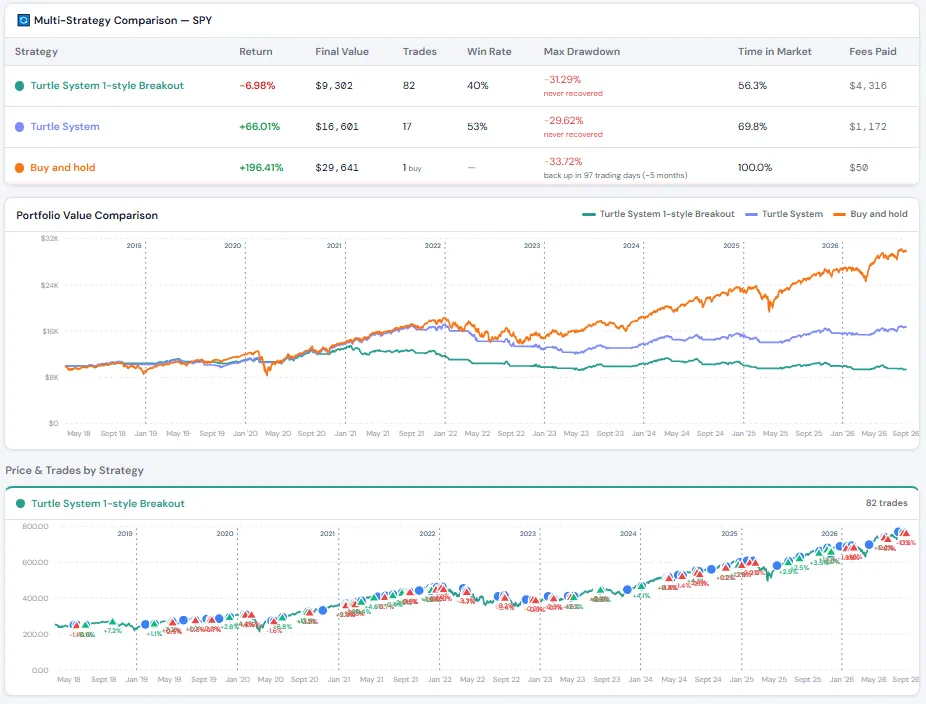
What you can do
Explore indicators
See indicators on historical charts, change their parameters and examine how they behave. Over 60 are available, each documented with what it measures, how its readings are conventionally interpreted and where it falls short.
Build without code
Create precise buy and sell rules using a visual logic tree with AND, OR and NOT. Seven classic strategies come ready-built to take apart. You can also combine indicators into signals of your own and test those the same way.
Test strategies
Run rules against historical data and inspect return, drawdown, exposure and individual trades. Set your own starting capital, fees and period. One stock, five stocks, or five strategies side by side.
Investigate events
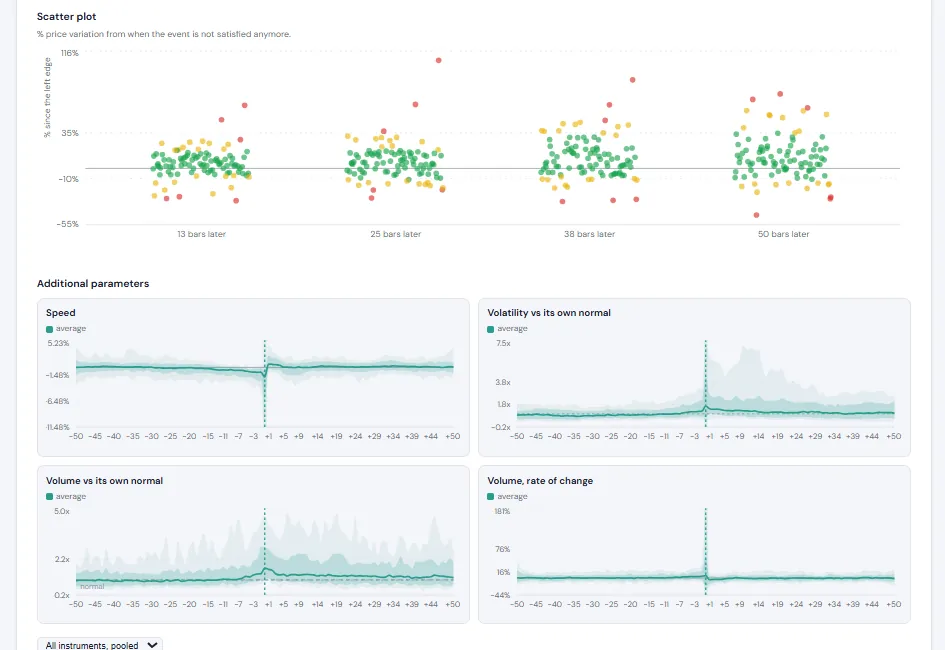
Define a market condition and examine what tends to happen around it across historical events. Reports price movement, speed, volatility and volume either side of the condition, with the number of events behind every figure.
Practise decisions
Replay historical market situations bar by bar with nothing at stake. The ticker and the dates are hidden, and you buy and sell as it unfolds. 22 scenarios covering trend, momentum, volume and risk.
Screen a universe
Filter a 200-stock universe on 62 computed technical metrics, or run one of your saved strategies across all of them and see which names it fires on.
Data available to you
Historical end-of-day market data. Real-time trading is currently not supported.
US stocks, ETFs and indices
Build backtests and event analyses across 400+ US-listed stocks, ETFs and indices using historical market data. Daily bars going back years, plus an hourly mode for shorter timeframes.
More markets over time
Additional markets and asset classes may follow as coverage and data licensing reach the same standard as the US data above.
Nothing here is a commitment to a particular market or date.
The useful skill is knowing what your rules actually do.
A simple pricing structure
Free: learn and test on SPY. Premium: the same workflow across 400+ US stocks, ETFs and indices.
No time limit. No card required.
The whole workflow on the S&P 500 ETF.
- 48 lessons across five courses
- All 60+ indicators documented in the reference library
- Pattern gallery, market regimes, scam protection
- Track your progress and resume where you left off
- Charts, backtesting and Event Analysis on the S&P 500 ETF (SPY) — a single fund holding the 500 largest US companies as one combined price
- Every indicator and every preset, fully configurable
- Run strategies one at a time and compare the results
- Save 3 custom indicators, 5 backtest strategies and 5 event strategies
- Event Analysis — define a condition on SPY and measure what happened around it
- Live Practice — all 22 scenarios, daily and hourly
- Screener preview on the Magnificent 7
The same workflow across 400+ instruments.
Or $139.99 a year — $11.67 a month, saving $27.89. Cancel any time.
- Everything in Free, unchanged
- Charts, backtesting and event analysis on 400+ US stocks, ETFs and indices
- Screener — the full 200-stock universe, 62 metrics
- Multi-ticker and multi-strategy backtests — up to five of either at once (Free runs one ticker, one strategy)
- Pool up to ten instruments into one event sample (Free studies SPY alone)
- 20 custom indicators, 15 backtest strategies and 15 event strategies saved
- Compare multiple tickers side by side
- US market data included
Listed in US Dollars. Your billing country decides the currency you are actually
charged in — UK customers are billed in pounds — and Paddle shows the exact
total in that currency before you confirm. VAT is included where applicable, and
sales tax may be added at checkout depending on your country or state.
Switch or cancel any time — cancelling returns you to Free rather than locking you out.
14-day money-back guarantee on your first payment, no reason needed.
Full refund policy in our Terms.
We collect the bare
minimum.
We ask for what's needed to run your account and the tools in it.
- No advertising trackers. We never sell your data
- Saved strategies and practice history are private to you
- Card details go to Paddle and never reach us
FAQ
What can I use GU Analyser for?
Learn the tools, put indicators on historical charts, build rules without code, backtest them, and see what happened around market events. It all runs on historical market data.
Do I need to know how to code?
No. The Strategy Builder is a visual logic tree: pick conditions and combine them with AND, OR and NOT.
What is Event Analysis?
You define a market condition — RSI below 30, say — and the app finds every stretch of history where it held, then measures what happened around those events. It reports price movement, speed, volatility and volume either side of the condition, with the number of events behind each figure.
Does GU Analyser tell me what to buy?
No. GU Analyser provides analytical and educational tools rather than investment recommendations, signals or alerts.
Will a backtested strategy make money?
A backtest shows how a set of rules behaved on historical data. It cannot predict future performance.
Is there a free plan?
Yes, with no card and no time limit. All 48 lessons and the reference library are free, and the tools run on the S&P 500 ETF (SPY), with a screener preview on the Magnificent 7. Premium at $13.99/month or $139.99/year runs the same tools across 400+ US stocks, ETFs and indices. UK customers are billed the equivalent in pounds.
Which markets and data are available?
Over 400 US stocks, ETFs and major indices on historical end-of-day data, plus an hourly mode for shorter timeframes. Real-time trading is not supported.
What do the charts show?
A closing-price line with the indicators you choose, layered over the price or in panels beneath it, plus a relative volume panel. Every parameter is adjustable.
Can I use every indicator on both timeframes?
Daily charts carry the full set. Hourly mode shows those that read reliably on intraday bars, and the app marks which are available in each mode.
How is this different from a charting platform?
GU Analyser combines learning, historical chart analysis, visual strategy building, backtesting and event analysis. It is designed for investigating an idea from several angles in one place.
Not answered here? Write to hello@guanalyser.com — we read everything.
I built this because I needed it.
Hi, I'm Alessio.
I'm an aerospace engineer. At work you don't get to claim something works — you model it, test it, and let the data decide.
When I started looking at technical analysis I found lots of confident claims and almost no way to check them.
So I built a place to check them. No signals. No invented track record. Just the tools to look.