Learn technical analysis
Start with the basics or go straight to a topic you want to understand. Lessons explain the concepts, and the app lets you put them on charts, change the settings and test what you have learned.
Free · no card needed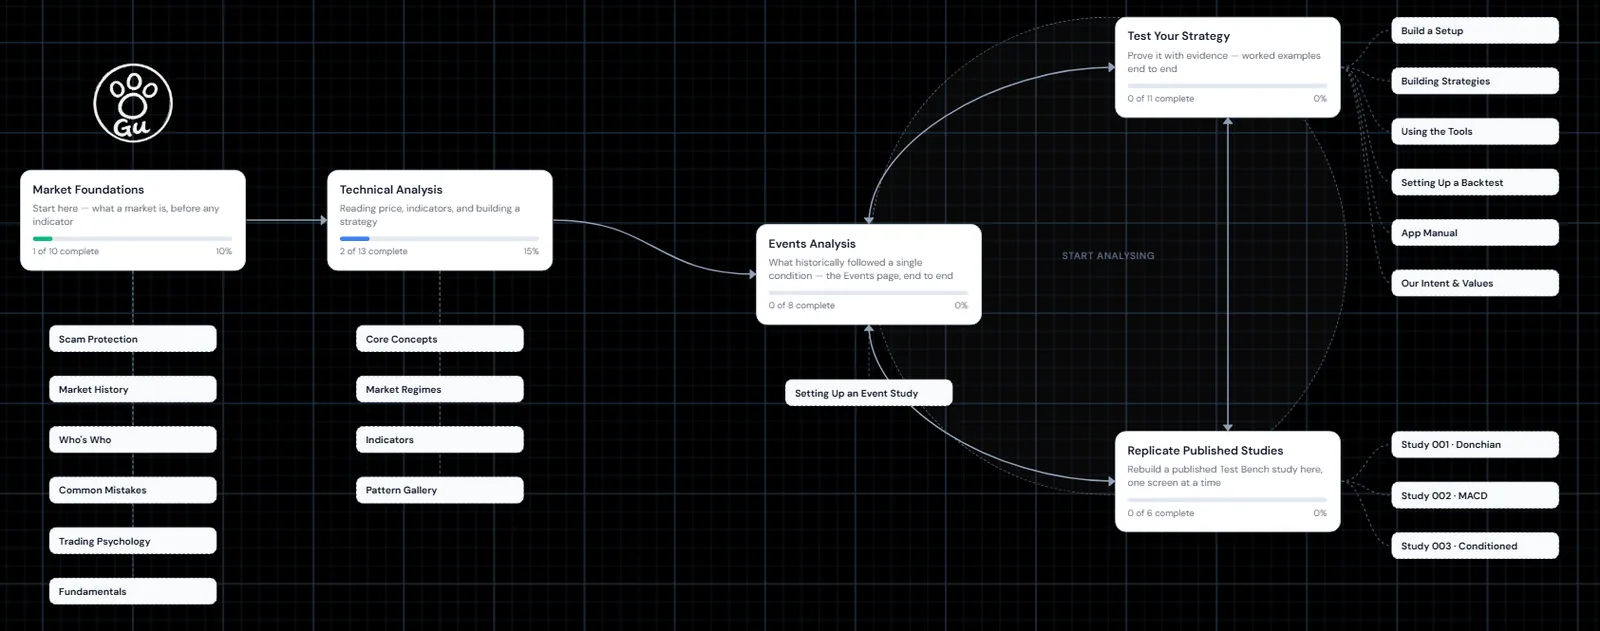
Courses — 5 covering 48 lessons
The courses cover the main topics. Start with the foundations, jump to a specific topic, or follow the suggested path. Several lessons open the relevant tool with the exact settings to enter.
Market Foundations
Start here if you're new. Ten short lessons that give you the vocabulary and the mental model everything else depends on.
10 lessons · tap any one for what it covers
What a market is
How a market matches buyers to sellers, what actually makes a price move, and what the bid, the ask and liquidity mean — the mechanics every chart rests on
Markets currently available
What you genuinely own when you buy a stock, an ETF or an index, and why each one has to be read in a different context
Reading a candle
Reading the four prices packed into every candlestick — open, high, low and close — and what the body and the wicks reveal about who controlled that period
Hours, sessions and gaps
When US markets are open, why a stock can gap from Friday’s close to Monday’s open with no trading in between, and what that means for holding overnight
The real cost of trading
The three costs taken out of every round trip — spread, fees and slippage — and why a strategy that looks profitable on paper can be a net loser once they are subtracted
Investor or swing trader?
Choosing your timeframe before you touch a chart, because it decides which tools, risks and mindset apply — and how trouble starts when a swing trade quietly "becomes an investment"
Drawdown: the maths of losing
The arithmetic that gets least attention: lose 20% and it takes 25% to get back, lose 50% and it takes 100%. Why the cost of a deep loss grows faster than the loss itself
Position sizing
How position size decides whether being wrong is survivable — what "risk" refers to in this context, the widely cited convention of risking 1–2% of an account on a single trade, and why sizing is what lets someone sit through a losing streak with an account still intact
Realistic expectations
What real progress looks like against what gets sold as progress, why consistent results take a long learning curve, and how to recognise get-rich-quick framing before it costs you
Put it together
Putting the whole course to work: look up your first ticker and read its candles, costs and structure on a real chart
Technical Analysis
The core of the app. Four stages: read price, understand indicators, turn a setup into rules, then test and execute it. Two lessons complete themselves the first time you use the tools for real.
13 lessons · tap any one for what it covers
Trend, support & resistance
Reading raw price structure before a single indicator is added — how to identify a trend, and why support and resistance levels hold as often as they do
Volume: the confirmation layer
How volume is conventionally read as a confirmation layer, where higher volume behind a move is generally treated as stronger confirmation than the same move on thin volume — and what that reading can and cannot tell you
Divergence
Spotting where momentum and price start to disagree. Traders commonly treat this as an early warning that a move is weaker than it appears, and the lesson covers how often that reading holds and how often it does not
Candlestick patterns
One-to-three-bar candlestick patterns and what each is conventionally read to suggest, plus the context that is generally held to matter more than the shape itself: where on the chart the pattern appears
Chart patterns
The larger formations that take ten to fifty bars or more to build, what they are conventionally read to suggest about continuation or reversal, and why longer-forming patterns are usually given more weight
The four indicator families
The idea worth more than memorising individual indicators: all ~60 sort into four jobs. Five momentum indicators agreeing is arguably one piece of evidence counted five times rather than five confirmations
Market regimes
Why the same indicator can give opposite results in different market conditions, and how to judge whether you are in a trending, ranging, volatile or disorderly regime before choosing tools
One indicator per layer
The anti-indicator-soup framework — one indicator per layer, so that agreement between four different kinds of evidence carries more weight than agreement between four measures of the same thing
From idea to rules
Turning "buy when it looks oversold in an uptrend" into an explicit rule that can be tested — conditions joined by AND and OR, read back as a live expression such as (RSI < 30 OR MACD > Signal) AND ADX > 25
Reading backtest metrics
What a backtest scorecard actually means — the four numbers that only make sense read together, and expectancy, which combines win rate and risk-to-reward into an average historical result per trade
Running a backtest
Replaying a saved strategy across years of real history before any money is at risk — and the over-optimisation trap, where settings tuned until the past looks perfect are fitted to that history and tend not to hold up afterwards
The mistakes that cost accounts
The behavioural mistakes commonly identified behind beginner losses — none of them about picking the wrong indicator, all of them about discipline
How the tools fit together
How the tools connect: explore indicators on charts, build rules without code, backtest them, investigate what follows a market condition, and practise on historical replays
Events Analysis
An event study asks one question: when this condition was true in the past, what happened around it? Eight lessons cover what the page measures, how to set a study up, what preconditions and side-by-side comparisons read, and how to tell a real pattern from an accident.
8 lessons · tap any one for what it covers
An event study measures one condition on its own
Measuring one condition on its own — every bar in history where it was true, and what price did around those bars, with no entry, exit, fee or position involved
The condition is built on its own canvas
Writing a condition in the same rule editor used for buy and sell rules, and how often a condition fires shapes what can be learned from it
Setting the study up
Choosing the windows either side of the trigger, why a snapshot counts bars rather than days, and the three ways a study can be run across tickers and conditions
Preconditions and side-by-side comparisons
What trend, volatility, squeeze and prior move read, and which one uses the future
Isolated and clustered events
Whether the condition fired once, or kept firing
Reading the figures
Reading the figures around the trigger, what the shaded band does and does not claim, and how the indicator panels reveal whether a rule fired where it was meant to
Reading the table
What each column measures — price change, speed, volatility, volume measured against that instrument’s own normal, share rising, worst dip, the extremes, and the worst tenth of cases
What makes a result trustworthy
The four event counts and why they differ, how clustered dates inflate an apparent sample, what a confidence interval containing zero means, and the limits of the method
Test Your Strategy
Two questions answered end to end with the app: does buying on RSI alone actually work, and how do you build a screen that combines indicators properly?
11 lessons · tap any one for what it covers
How to test a claim
The four steps behind testing any trading claim — state it precisely, express it as rules, run it on history, then read the result honestly
Case 1 · See it on a chart
What an RSI reading below 30 actually looks like on a real chart, and why "oversold" is not the same as "about to go up"
Case 1 · Write the strategy
Turning "buy when RSI is oversold" into exact buy and sell rules a backtest can execute — the point where a claim becomes testable
Case 1 · Test it on four stocks
Running one RSI strategy across four different stocks, because a result from a single chart over a single period is not evidence
Case 1 · Read the verdict
Reading a backtest result properly — return against drawdown, win rate against the size of the losses, and what the equity curve shows that a summary number hides
Case 1 · Fix it and re-test
Adding a single trend condition to the same strategy and re-running it, to see how much one rule changes the outcome
Case 1 · Now try your own
Four questions about indicators worth putting through the same test yourself, on tickers you pick
Case 2 · Build a real screen
Building a stock screen from four indicators that each answer a different question — trend, momentum, volatility and volume — rather than four that repeat one another
Case 2 · Verify, save, then test
Checking a screen against the charts, saving it, then backtesting it — and why a screen produces a shortlist to investigate, never a decision
Case 2 · Now try your own
Four more screens worth building, and how to tell whether yours is too loose or too tight
The seven questions
The seven questions worth answering before risking anything — and the eighth question nobody can answer, which is how you spot who is selling something
Replicate Published Studies
Every Test Bench study states its method so it can be rebuilt. Three lessons cover the approach — why, what to copy out of an article, and how to define a benchmark — then one lesson per published study carries its complete rebuild on the real screens.
6 lessons · tap any one for what it covers
Why rebuild a published test
A result you can reproduce is evidence; one you cannot is a claim
Read the method before the result
The six things to copy out of any study
Define a benchmark
A result means nothing until you say what it is being measured against
Study 001 · Donchian breakouts
The complete rebuild: custom indicators, both rules, the run, and the benchmark
Study 002 · MACD crossovers
The complete rebuild: the event, the zero-line split, and the check the study turned on itself
Study 003 · The conditioned comparison
Study 002's event inside one trend and volatility combination at a time
Reference library — 17 sections
Pages to read alongside the courses and to come back to. Grouped below by the course they sit closest to, as the map draws them; published Test Bench studies sit beside the course that rebuilds them.
Alongside Market Foundations
Scam Protection
How trading scams work and how to recognise them: Ponzi schemes, signal sellers and paid “gurus”, pump-and-dumps, managed-account and credential theft, and high-cost courses and mentorships — with the red flags they share and how to verify a broker or platform.
Market History
Eight major market events, their drawdowns and recovery periods: the 1929 Wall Street Crash, Black Monday, the dot-com bust, the 2008 financial crisis, the COVID crash, the GameStop squeeze and the inflation bear market.
Who's Who
The investors worth knowing about — Charles Dow, Benjamin Graham, Jesse Livermore, Warren Buffett, Peter Lynch, George Soros, Jim Simons, Ray Dalio — and the people who invented the indicators in your charts panel: Wilder, Bollinger, Appel, Lane, Donchian, Keltner, Chaikin and others, with what each was arguing.
Common Mistakes
Eight common errors involving risk, stops, over-optimisation and trading discipline — indicator soup, fighting the trend, moving a stop loss, chasing on FOMO, revenge trading, poor risk-to-reward, ignoring the regime and over-optimisation — each with a specific fix.
Trading Psychology
How emotions, discipline and loss tolerance can affect decisions: fear, greed, and why a plan made at the weekend gets abandoned on Tuesday morning.
Fundamentals
An introduction to earnings, valuation and balance sheets, and what a company's numbers show that price and volume do not.
Alongside Technical Analysis
Core Concepts
Candlesticks and OHLC, support and resistance, telling a trend from a range or a chop, timeframes and why they disagree, volume, divergence, moving averages, chart patterns and the basics of risk.
Market Regimes
The four market regimes — trending, ranging, high volatility, and bear or capitulation — how to recognise which one you are in, and which indicators behave differently in each.
Indicators
A page for every one of the ~60 indicators in the app: what it measures, the thresholds conventionally treated as meaningful, the conditions where it is considered more or less useful, which indicators it is normally read alongside, and its known limitations. Free to read outside the app, with no account needed.
Pattern Gallery
Eight candlestick patterns drawn out bar by bar — doji, hammer, shooting star, bullish and bearish engulfing, morning and evening star, and the inside bar — with what forms each one, what it is conventionally read to mean, and how reliable that reading is.
Alongside Events Analysis
Setting Up an Event Study
Build the condition on its own one-terminal canvas, then configure the study: pooled instruments, history, horizons, preconditions and side-by-side comparisons.
Alongside Replicate Published Studies
Study 001 · Do Donchian Channel Breakouts Actually Work?
Three classic breakout rules tested across 179 US stocks, with Buy & Hold comparisons, fees, drawdowns, ADX and different market conditions.
Study 002 · What Happens After a MACD Crossover?
15,698 bullish MACD signal-line crossovers across 197 US large-cap stocks, 2018 to 2026, measured over the following 35 trading days against the same measurement taken from every trading day in those stocks.
Study 003 · A Stronger Benchmark for the MACD Crossover
Study 002 compared MACD crossovers with every trading day. A reader asked if that was fair, so we re-ran the test only against days with similar trend and volatility, with a calendar-block bootstrap interval on each crossover-minus-comparison difference.
Alongside Test Your Strategy
Build a Setup
How to assemble a coherent setup: a position-sizing calculator, a four-layer framework separating trend, momentum, volatility and risk, and example stacks to take apart and modify.
Building Strategies
How to write buy and sell rules precisely enough for a computer to follow, without code: the shape of a single condition, what each operator means including crossovers, comparing an indicator against a number or against another indicator, and how AND/OR groups resolve the ambiguity in a rule like “A and B or C”.
Using the Tools
A walkthrough of Charts, Screening and the indicator Configuration — one concrete task each, the exact values to enter, and what you should see when it has worked.
Setting Up a Backtest
Real screenshots of the current screens: pick or build a strategy, then configure Mode, Run over, Period, cash and fees before you run it.
App Manual
Where everything lives: getting started, each tool in depth, and an example workflow from looking up a stock to reading a finished backtest.
Our Intent & Values
What this app is for, what it refuses to be — no signals, no alerts, no recommendations — and how it treats your data and your money.
Learn it. Then investigate it.
Lessons explain what a concept or indicator measures. Charts let you explore it on historical data. Strategy Builder and Backtesting let you turn an idea into rules and test them. Event Analysis lets you examine what happens around a defined condition.
The indicator reference is open to everyone
The Indicators section above is also published outside the app, with no account needed: a page for every indicator in GU Analyser covering what it measures, how its readings are conventionally interpreted, the levels people use, and where it is known to fall short. Start at the technical indicator reference, or go straight to a common one — RSI, MACD, Bollinger Bands or ADX.
And the rules themselves get tested
Lessons explain indicators and concepts. The Test Bench examines specific market claims using defined methods and historical data. Published studies show the question, the assumptions, the comparison and the result.
- A Stronger Benchmark for the MACD Crossover — Study 002 compared MACD crossovers with every trading day. A reader asked if that was fair, so we re-ran the test only against days with similar trend and volatility, with a calendar-block bootstrap interval on each crossover-minus-comparison difference.
- What Happens After a MACD Crossover? — 15,698 bullish MACD signal-line crossovers across 197 US large-cap stocks, 2018 to 2026, measured over the following 35 trading days against the same measurement taken from every trading day in those stocks.
- Do Donchian Channel Breakouts Actually Work? — Three classic breakout rules tested across 179 US stocks, with Buy & Hold comparisons, fees, drawdowns, ADX and different market conditions.
What it costs
All 48 lessons and every reference section are free. The free plan also runs the tools on the S&P 500 ETF (SPY), with the screener on the Magnificent 7. Premium widens the same tools across 400+ US stocks, ETFs and indices — see pricing.
Plot it yourself. Add this indicator to a chart, change every parameter and watch the line move, then backtest how the rule would have behaved on historical data — free on the S&P 500 ETF, no card.
Create a free account or start with the lessons →