The Test Bench › Study 003
A Stronger Benchmark for the MACD Crossover
Does Study 002's result survive conditioning on trend and volatility?
STUDY 003The short version
Study 002 compared the 35-day return after bullish MACD crossovers with every eligible trading day in the same 197 stocks. Crossovers don't appear randomly across market conditions, so that unconditional benchmark may mix very different environments.
This study compares each crossover only with ordinary days that share the same broad trend and volatility labels: price above or below its 200-day average, and NATR above or below that stock's full-period median. The stocks, the period and the 35-day return are unchanged.
Comparison-day median returns ranged from 0.59% to 3.15% across the four categories. Within them, crossover-minus-comparison differences ranged from -0.34 to +0.39 percentage points.
The 95% calendar-block bootstrap interval for the crossover-minus-comparison difference included zero in all four primary market-state cells. Across other block lengths and alignments, three of the four cells had intervals including zero in all 12 robustness runs. Price above SMA200 · Calmer than usual (-0.34 percentage points) was sensitive to the bootstrap specification: its interval excluded zero in two of 12 runs.
In an exploratory follow-up, below-zero crossover medians were above their comparison medians in all four cells and above-zero crossover medians were below theirs. Prior return was not held fixed, so this pattern may partly reflect the decline that often precedes a below-zero crossover.
The conditioning is still coarse — only two-way splits, no one-to-one matching. A tighter match that also includes prior return is left for a follow-up.
This study follows Study 002 and uses the same events, stocks and 35-day measure.
This looks at what happened in past data. It is not advice and does not predict future returns.
Full research: method, results and limitations
Every table, figure and assumption behind the summary above
The question
Study 002 compared every bullish MACD crossover with one unconditional benchmark: the median 35-day return of every eligible trading day in the same stocks, 1.94%. Crossovers returned 1.85%, a difference of -0.09 percentage points (pp). A reader challenged that benchmark:
“MACD crossovers may occur after particular volatility or trend conditions, so matching only the same stocks may not isolate the signal's contribution. A benchmark matched for prior returns, volatility, and market regime would test that conclusion more cleanly.”
The reader named three areas: prior returns, volatility and market regime. This study conditions on two of them, trend and volatility, using two-way categories. Prior return is left for follow-up work.
Question: does Study 002's overall conclusion change when crossover days are compared only with ordinary trading days in the same broad trend and volatility states?
How the comparison was built
The stocks, the period and the event are unchanged from Study 002: 197 US large-cap stocks, 2018-03-12 to 2026-09-03, MACD 12 / 26 / 9, and the return from the crossover bar's close to the close 35 trading days later. Every eligible trading day, meaning every day with 35 trading days of data after it, carries two labels:
- Trend. The close above or below its 200-day simple moving average.
- Volatility. NATR, average true range as a share of price, below or above that stock's median NATR over 2018–2026.
The comparison median for a market state is the median 35-day return across all eligible trading days with that state's labels. The difference is the crossover median minus the comparison median for the same state, in pp; a positive difference means crossovers returned more than comparison days in that state.
| Market state | Trading days in this state | Comparison median |
|---|---|---|
| Price above SMA200 · Calmer than usual | 148,251 | 1.44% |
| Price above SMA200 · More volatile than usual | 97,736 | 2.44% |
| Price below SMA200 · Calmer than usual | 49,903 | 0.59% |
| Price below SMA200 · More volatile than usual | 110,323 | 3.15% |
Crossover days are included in each comparison pool, as in Study 002, and make up 3.5% to 4.1% of the days in each state; removing them moves the comparison medians by at most 0.013pp.
The conditioning is coarse. Each label is a two-way category, so a stock just above its median NATR and one far above it share a label, and no crossover is paired with individually similar days.
How uncertainty was estimated
Crossover returns are not independent observations. The same stock contributes many crossovers, 35-day windows from nearby dates overlap, and stocks move together on the same days. The crossover counts therefore overstate the amount of independent information.
We use a calendar-block bootstrap. The calendar is divided into contiguous blocks of 49 calendar days, about 35 trading days. In each of 2,000 replications:
- one set of blocks is drawn with replacement, for crossovers and comparison days together;
- every crossover and every comparison day inside the drawn blocks is kept;
- the crossover median, the comparison median and their difference are recomputed.
The 95% interval runs from the 2.5th to the 97.5th percentile of the replicated differences. Before any interval was calculated, the rebuilt samples reproduced the published counts and medians in every group. The intervals are not adjusted for the number of cells examined.
The calendar blocks preserve much of the local time dependence created by overlapping windows and common market dates. The bootstrap is an approximation to the dependence structure: windows that straddle a block boundary, the same stock recurring across blocks and market episodes longer than a block are handled imperfectly. The crossovers in each group fall in 50 to 62 blocks; those in each primary cell fall in 60 to 62, against 63 for all crossovers together.
We repeated the bootstrap with 5,000 replications at block lengths of 49, 70, 98 and 147 calendar days, each with fixed blocks, blocks shifted by half a block, and a circular block bootstrap: 12 runs per cell. For Price above SMA200 · Calmer than usual (-0.34pp), the interval bound nearest zero ranged from -0.054pp to +0.076pp, and the interval excluded zero in two of the 12 runs (70 days with fixed blocks; 147 days with fixed blocks). The other three cells included zero in every run. At 147 days the calendar holds fewer than 30 blocks, so those intervals rest on few resampling units.
Primary result: trend × volatility
Trend and volatility are correlated. Above the 200-day average, 59.6% of crossovers fall on calmer-than-usual days; below it, 33.9%. The primary analysis therefore conditions on both at once, and each cell is compared only with trading days that share both labels.
| Market state | Crossovers | Crossover median | Comparison median | Difference | 95% interval for the difference |
|---|---|---|---|---|---|
| Price above SMA200 · Calmer than usual | 5,882 | 1.10% | 1.44% | -0.34pp | -0.67pp to +0.04pp |
| Price above SMA200 · More volatile than usual | 3,988 | 2.35% | 2.44% | -0.09pp | -0.48pp to +0.45pp |
| Price below SMA200 · Calmer than usual | 1,977 | 0.98% | 0.59% | +0.39pp | -0.37pp to +1.03pp |
| Price below SMA200 · More volatile than usual | 3,851 | 3.28% | 3.15% | +0.12pp | -0.89pp to +0.95pp |
Comparison-day medians ranged from 0.59% to 3.15%, a spread of 2.56pp. Within the four cells, crossover-minus-comparison differences ranged from -0.34pp to +0.39pp. The 95% calendar-block bootstrap interval for the crossover-minus-comparison difference included zero in all four primary market-state cells. The Price above SMA200 · Calmer than usual cell was sensitive to the bootstrap specification: its interval excluded zero in two of 12 robustness runs using other block lengths and alignments. Study 002's weak overall crossover result is not explained simply by comparing crossover days with ordinary days drawn from very different trend and volatility environments.
NATR is compared with each stock's median over 2018–2026. The same rule is applied symmetrically to crossover and comparison days, but the volatility label is not ex ante and could not have been known at the time.
Exploratory follow-up: the MACD zero-line split
Study 002 had already suggested different behaviour above and below the MACD zero line. This follow-up splits the same four cells by the sign of the MACD line at the crossover. It sits outside the main benchmark test. Comparison days are the same four sets as in the primary result.
Below the zero line
| Market state | Crossovers | Crossover median | Comparison median | Difference | 95% interval for the difference |
|---|---|---|---|---|---|
| Price above SMA200 · Calmer than usual | 1,727 | 1.48% | 1.44% | +0.04pp | -0.82pp to +1.04pp |
| Price above SMA200 · More volatile than usual | 1,795 | 2.79% | 2.44% | +0.35pp | -0.78pp to +1.58pp |
| Price below SMA200 · Calmer than usual | 1,636 | 1.22% | 0.59% | +0.63pp | -0.22pp to +1.34pp |
| Price below SMA200 · More volatile than usual | 3,407 | 3.60% | 3.15% | +0.45pp | -0.66pp to +1.45pp |
Above the zero line
| Market state | Crossovers | Crossover median | Comparison median | Difference | 95% interval for the difference |
|---|---|---|---|---|---|
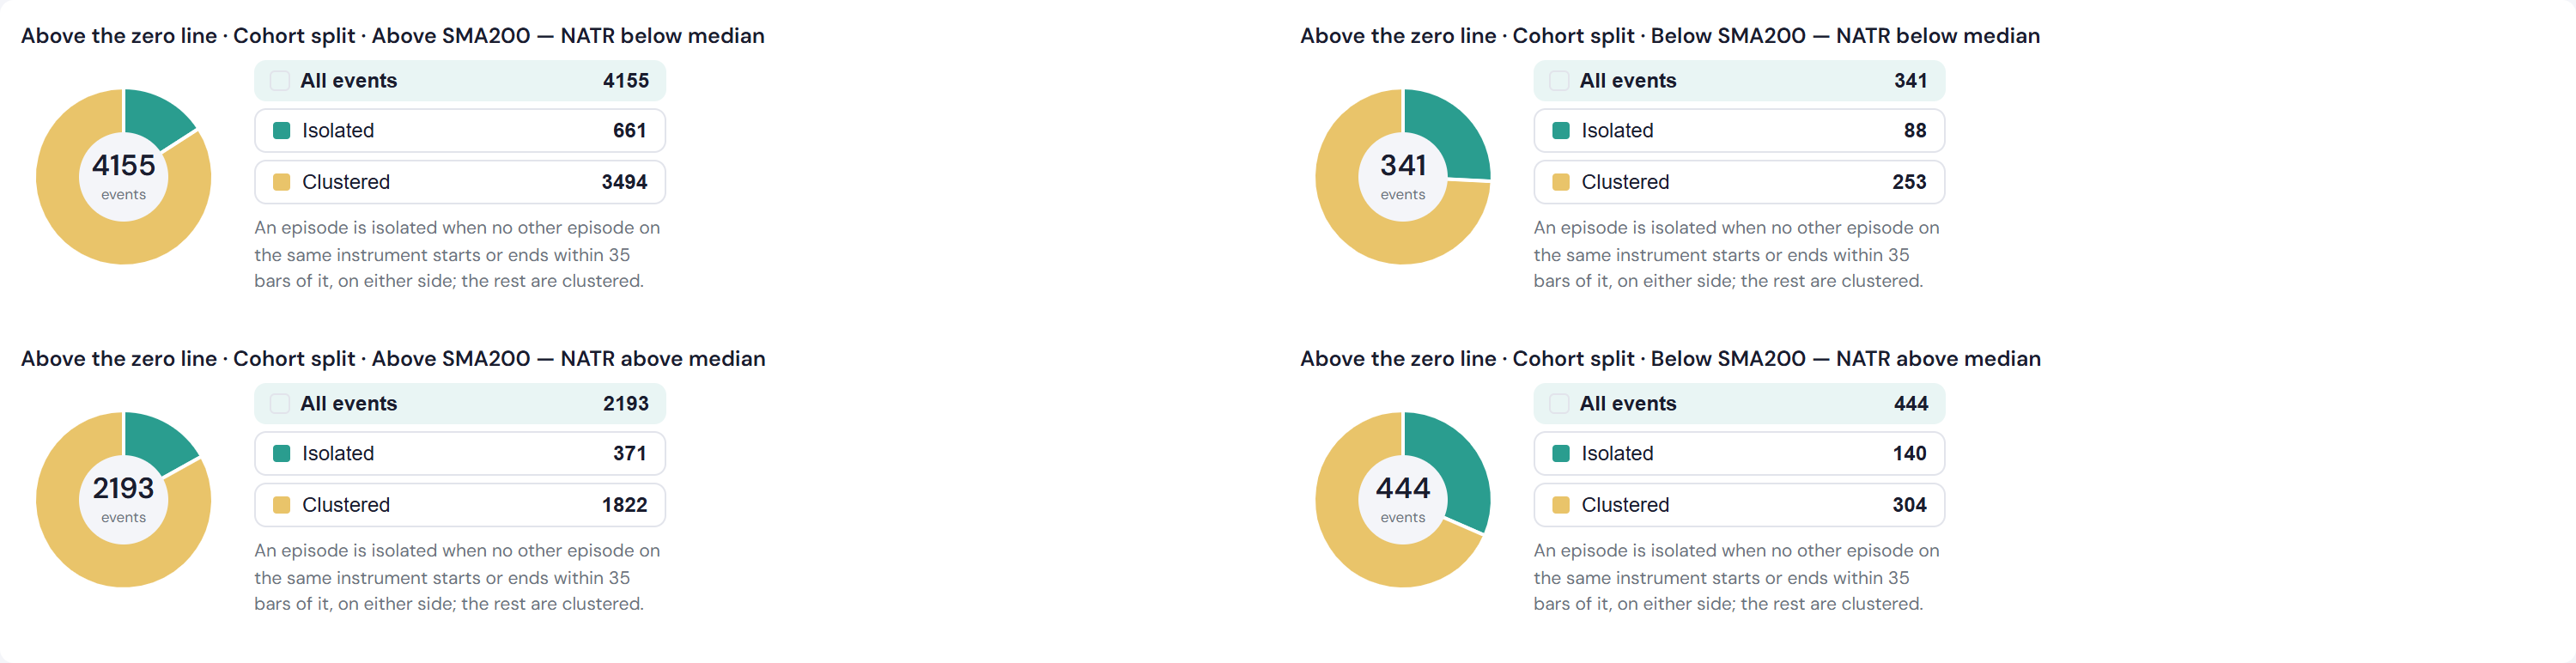
| Price above SMA200 · Calmer than usual | 4,155 | 0.98% | 1.44% | -0.47pp | -0.90pp to -0.08pp |
| Price above SMA200 · More volatile than usual | 2,193 | 2.13% | 2.44% | -0.30pp | -1.24pp to +0.37pp |
| Price below SMA200 · Calmer than usual | 341 | -0.21% | 0.59% | -0.80pp | -2.18pp to +0.58pp |
| Price below SMA200 · More volatile than usual | 444 | 1.14% | 3.15% | -2.01pp | -3.68pp to -0.15pp |
Below-zero crossover differences were positive in all four cells (+0.04pp to +0.63pp) and above-zero differences negative in all four (-0.30pp to -2.01pp). This directional pattern is interesting but exploratory.
Two of the eight 95% intervals exclude zero: Price above SMA200 · Calmer than usual, above the zero line (-0.47pp, interval -0.90pp to -0.08pp); Price below SMA200 · More volatile than usual, above the zero line (-2.01pp, interval -3.68pp to -0.15pp). They are weak evidence on their own: eight related cells were examined, no multiplicity adjustment was made, and all eight share the same calendar history. The two thinnest cells hold 341 and 444 crossovers, in 51 and 50 calendar blocks.
Below-zero bullish crossovers often follow declines, so the zero-line contrast may partly reflect the preceding price movement. An exploratory run that replaced volatility with the direction of the previous 35-day move weakened its consistency: three of four below-zero cells were above their comparison medians and three of four above-zero cells below. A fuller prior-return match is left for follow-up work.
For continuity with Study 002, the appendix shows price paths for crossovers classified retrospectively as isolated or clustered. Isolation needs the following 35 trading days to classify, so these figures are descriptive and do not test an ex-ante signal.
Conclusion
What was observed
Comparison-day median 35-day returns varied substantially across market states, from 0.59% to 3.15%. Within those states, crossover-minus-comparison differences ranged from -0.34pp to +0.39pp. The 95% calendar-block bootstrap interval for the crossover-minus-comparison difference included zero in all four primary market-state cells. The Price above SMA200 · Calmer than usual cell was sensitive to the bootstrap specification: its interval excluded zero in two of 12 robustness runs using other block lengths and alignments.
What this adds to Study 002
Study 002's overall weak crossover result is not explained simply by its use of an unconditional benchmark combining different trend and volatility environments (-0.09pp without conditioning; -0.34pp to +0.39pp within the four cells).
What it does not establish
This does not show that MACD contains no information. The conditioning is coarse and categorical; the volatility classification uses hindsight; prior return is not held fixed; the block bootstrap approximates the dependence structure; several exploratory cuts were examined; returns carry no market or factor adjustment; and the sample is one universe over one period.
Limitations and next tests
- Coarse conditioning. Each label is a two-way category, and no crossover is paired with individually similar days.
- Hindsight volatility label. NATR is compared with each stock's median over 2018–2026, so the label uses information from after earlier events. A trailing median or percentile built only from data before each event would make it ex ante.
- Prior return not held fixed. The zero-line contrast may partly reflect the price movement before the crossover.
- Approximate inference. The block bootstrap approximates the dependence structure, and interval width may depend on the chosen block length. The intervals are percentile intervals for a difference of medians, with no adjustment for the number of cells.
- Several cuts. Trend, volatility, their combination, both sides of the zero line and the prior move were each examined, without a multiple-testing adjustment.
- No market or factor adjustment, and one universe over one period: 197 of today's US large caps over 2018–2026, with survivorship in the selection.
- Not a strategy test. As in Study 002, no entry, exit, position size or transaction cost is simulated.
Next tests: match on prior return; classify volatility ex ante; use dependence-aware event-study inference, including sensitivity to the resampling specification; estimate market- or factor-adjusted returns; adjust exploratory specifications for multiple testing; and validate the findings on a different period or universe.
How to reproduce this
Build the crossover event across the same stocks and set the horizon to 35. In Event — setup, set the Trend precondition to above or below SMA200 and the Volatility precondition to Non-volatile (calmer than usual) or Volatile (more volatile than usual), then run. The crossovers and the comparison days are both limited to that combination, so each run gives one cell of the primary result, and four runs give all four. Step-by-step walkthrough.
The app pools up to ten stocks and this study pooled 197, so a rebuild runs on a smaller sample and its figures will differ. The intervals for the difference and the block-length check came from the study harness.
Appendix: retrospective isolated and clustered crossovers
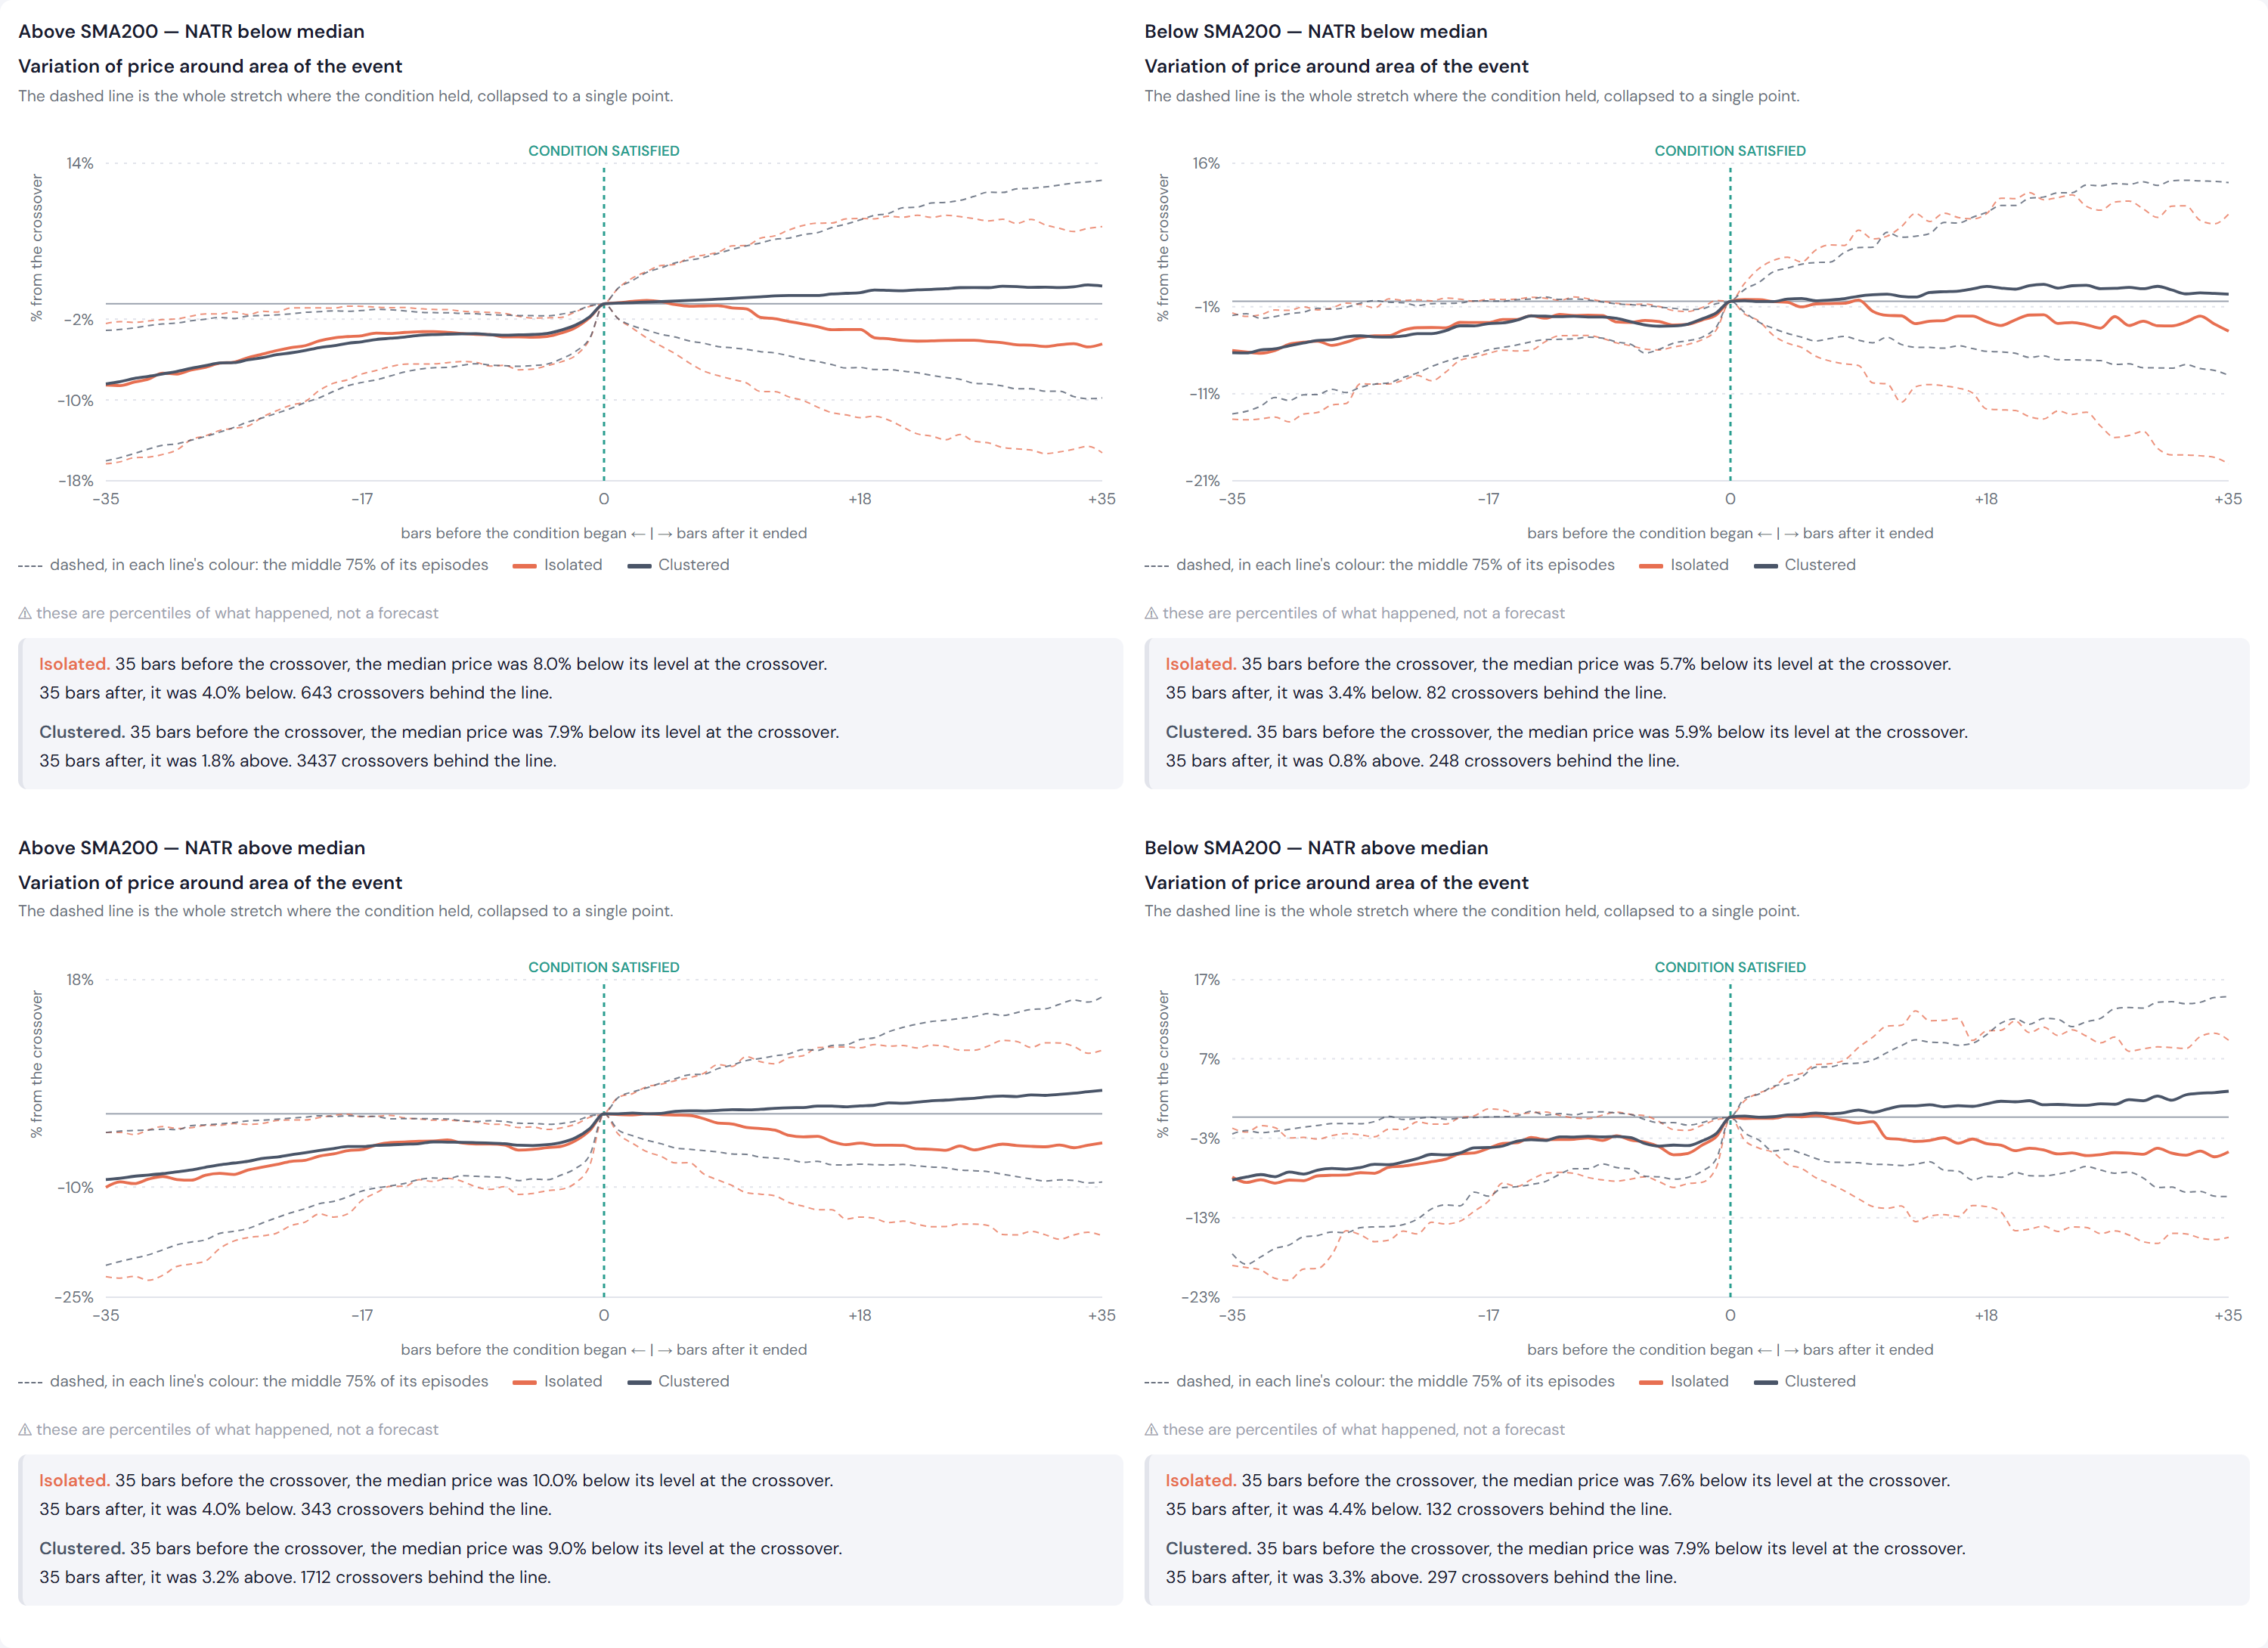
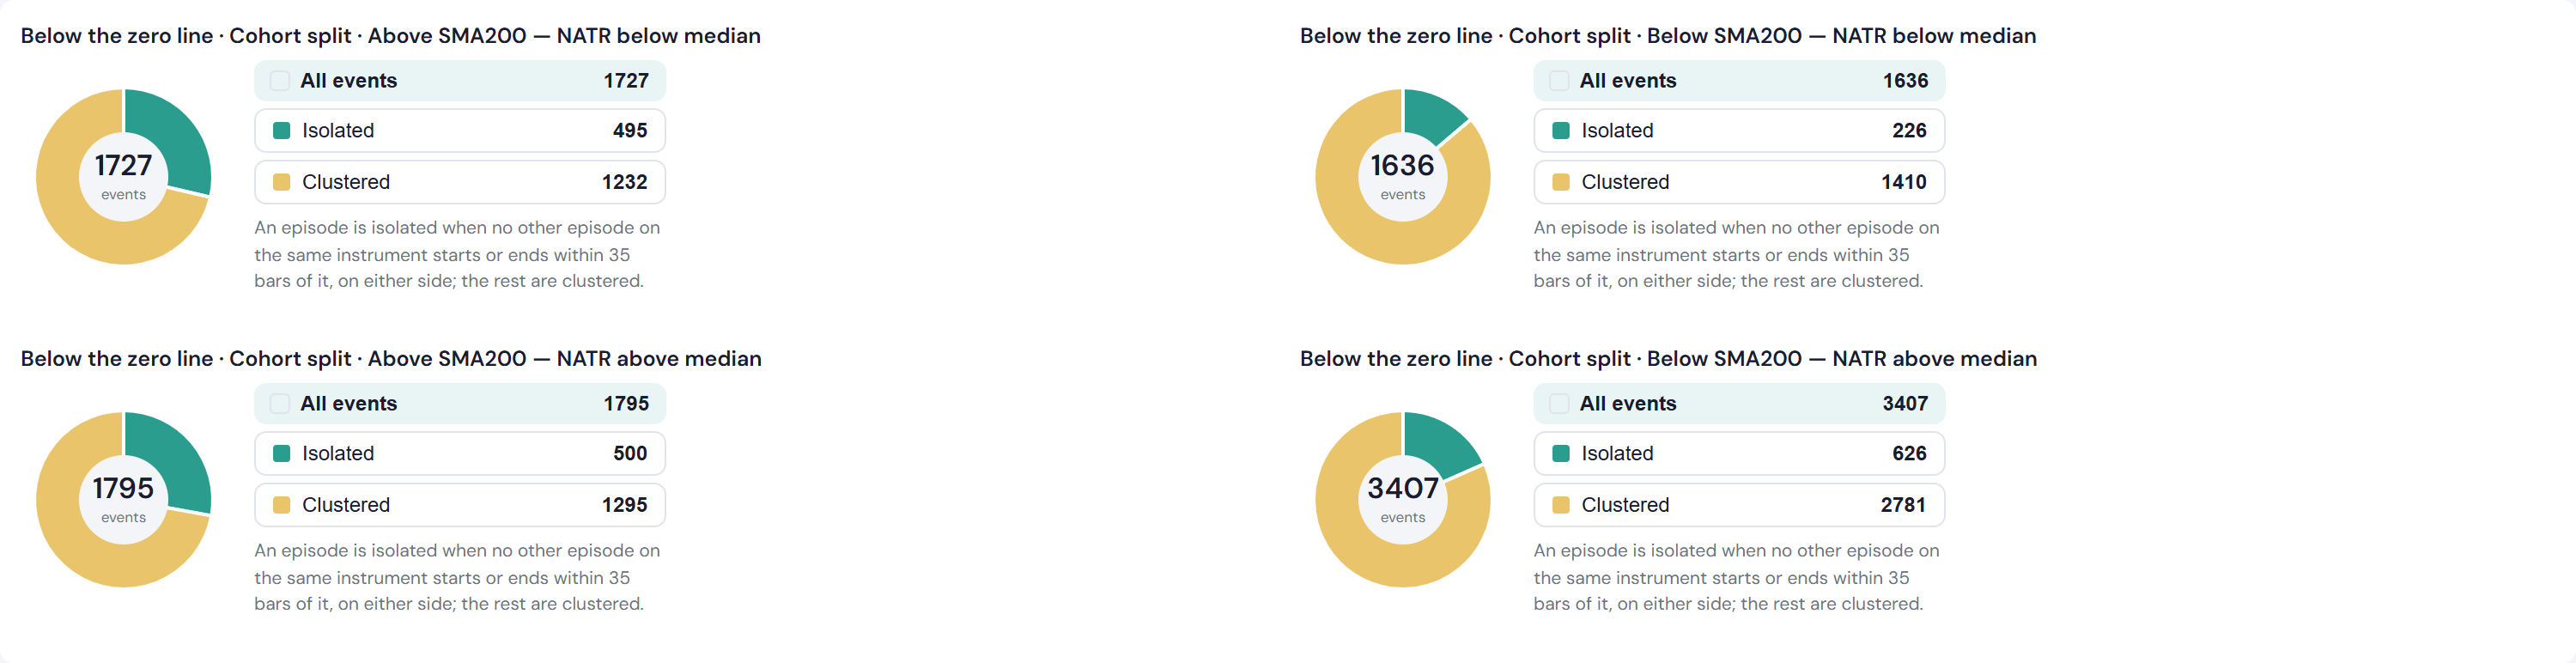
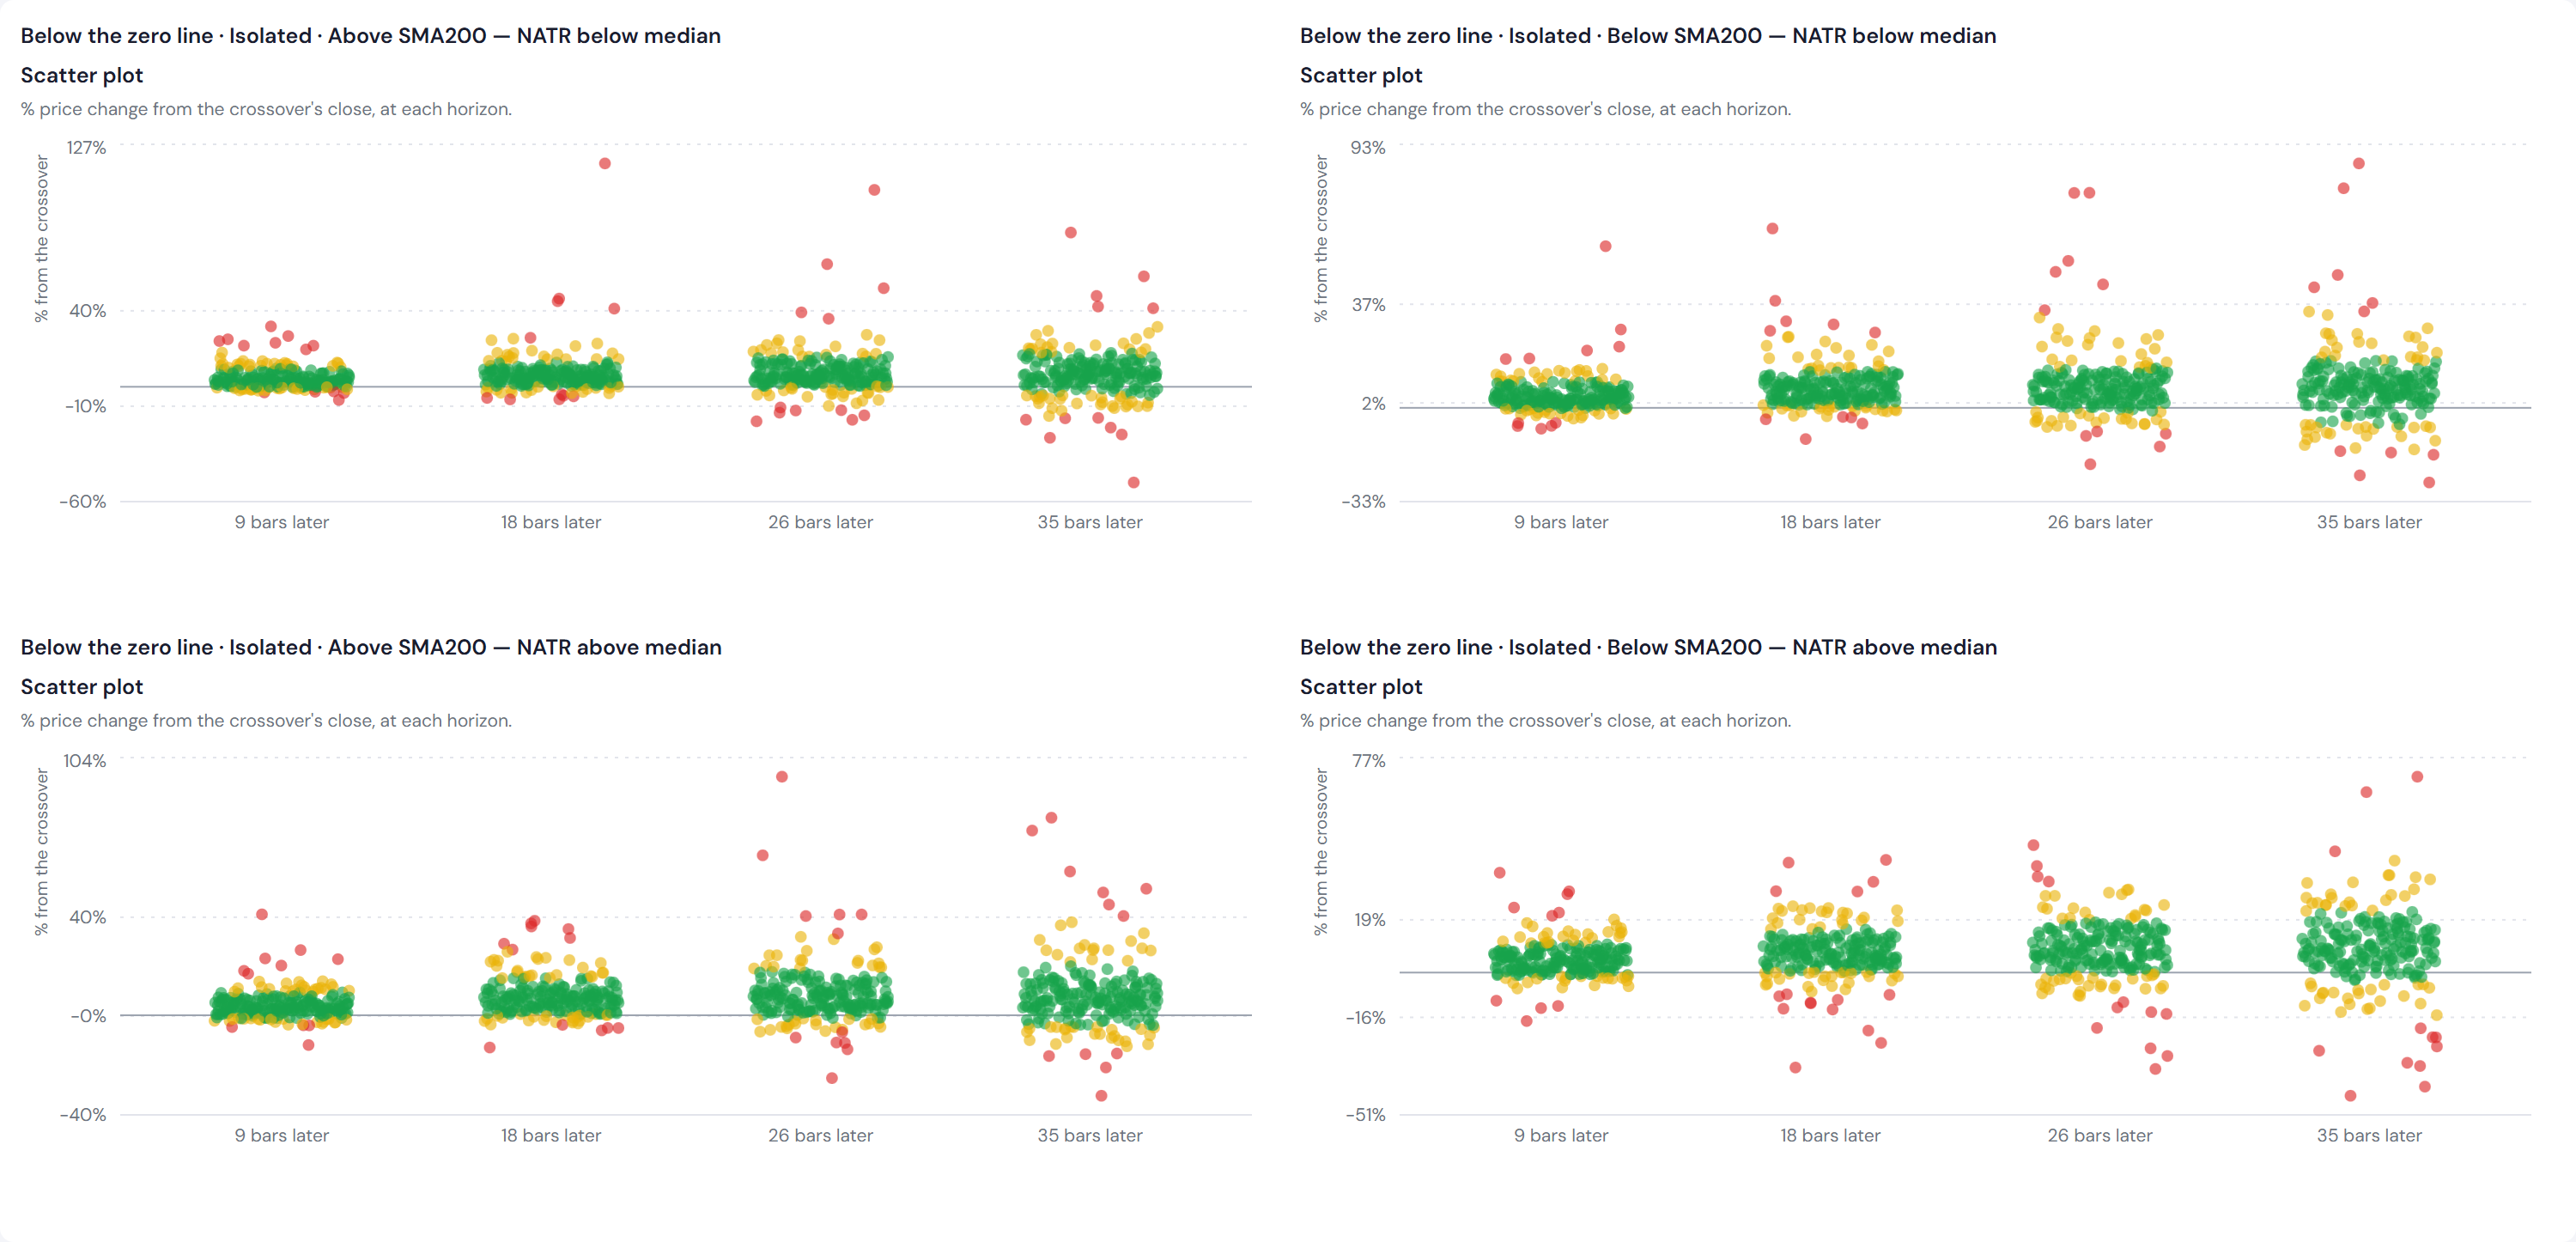
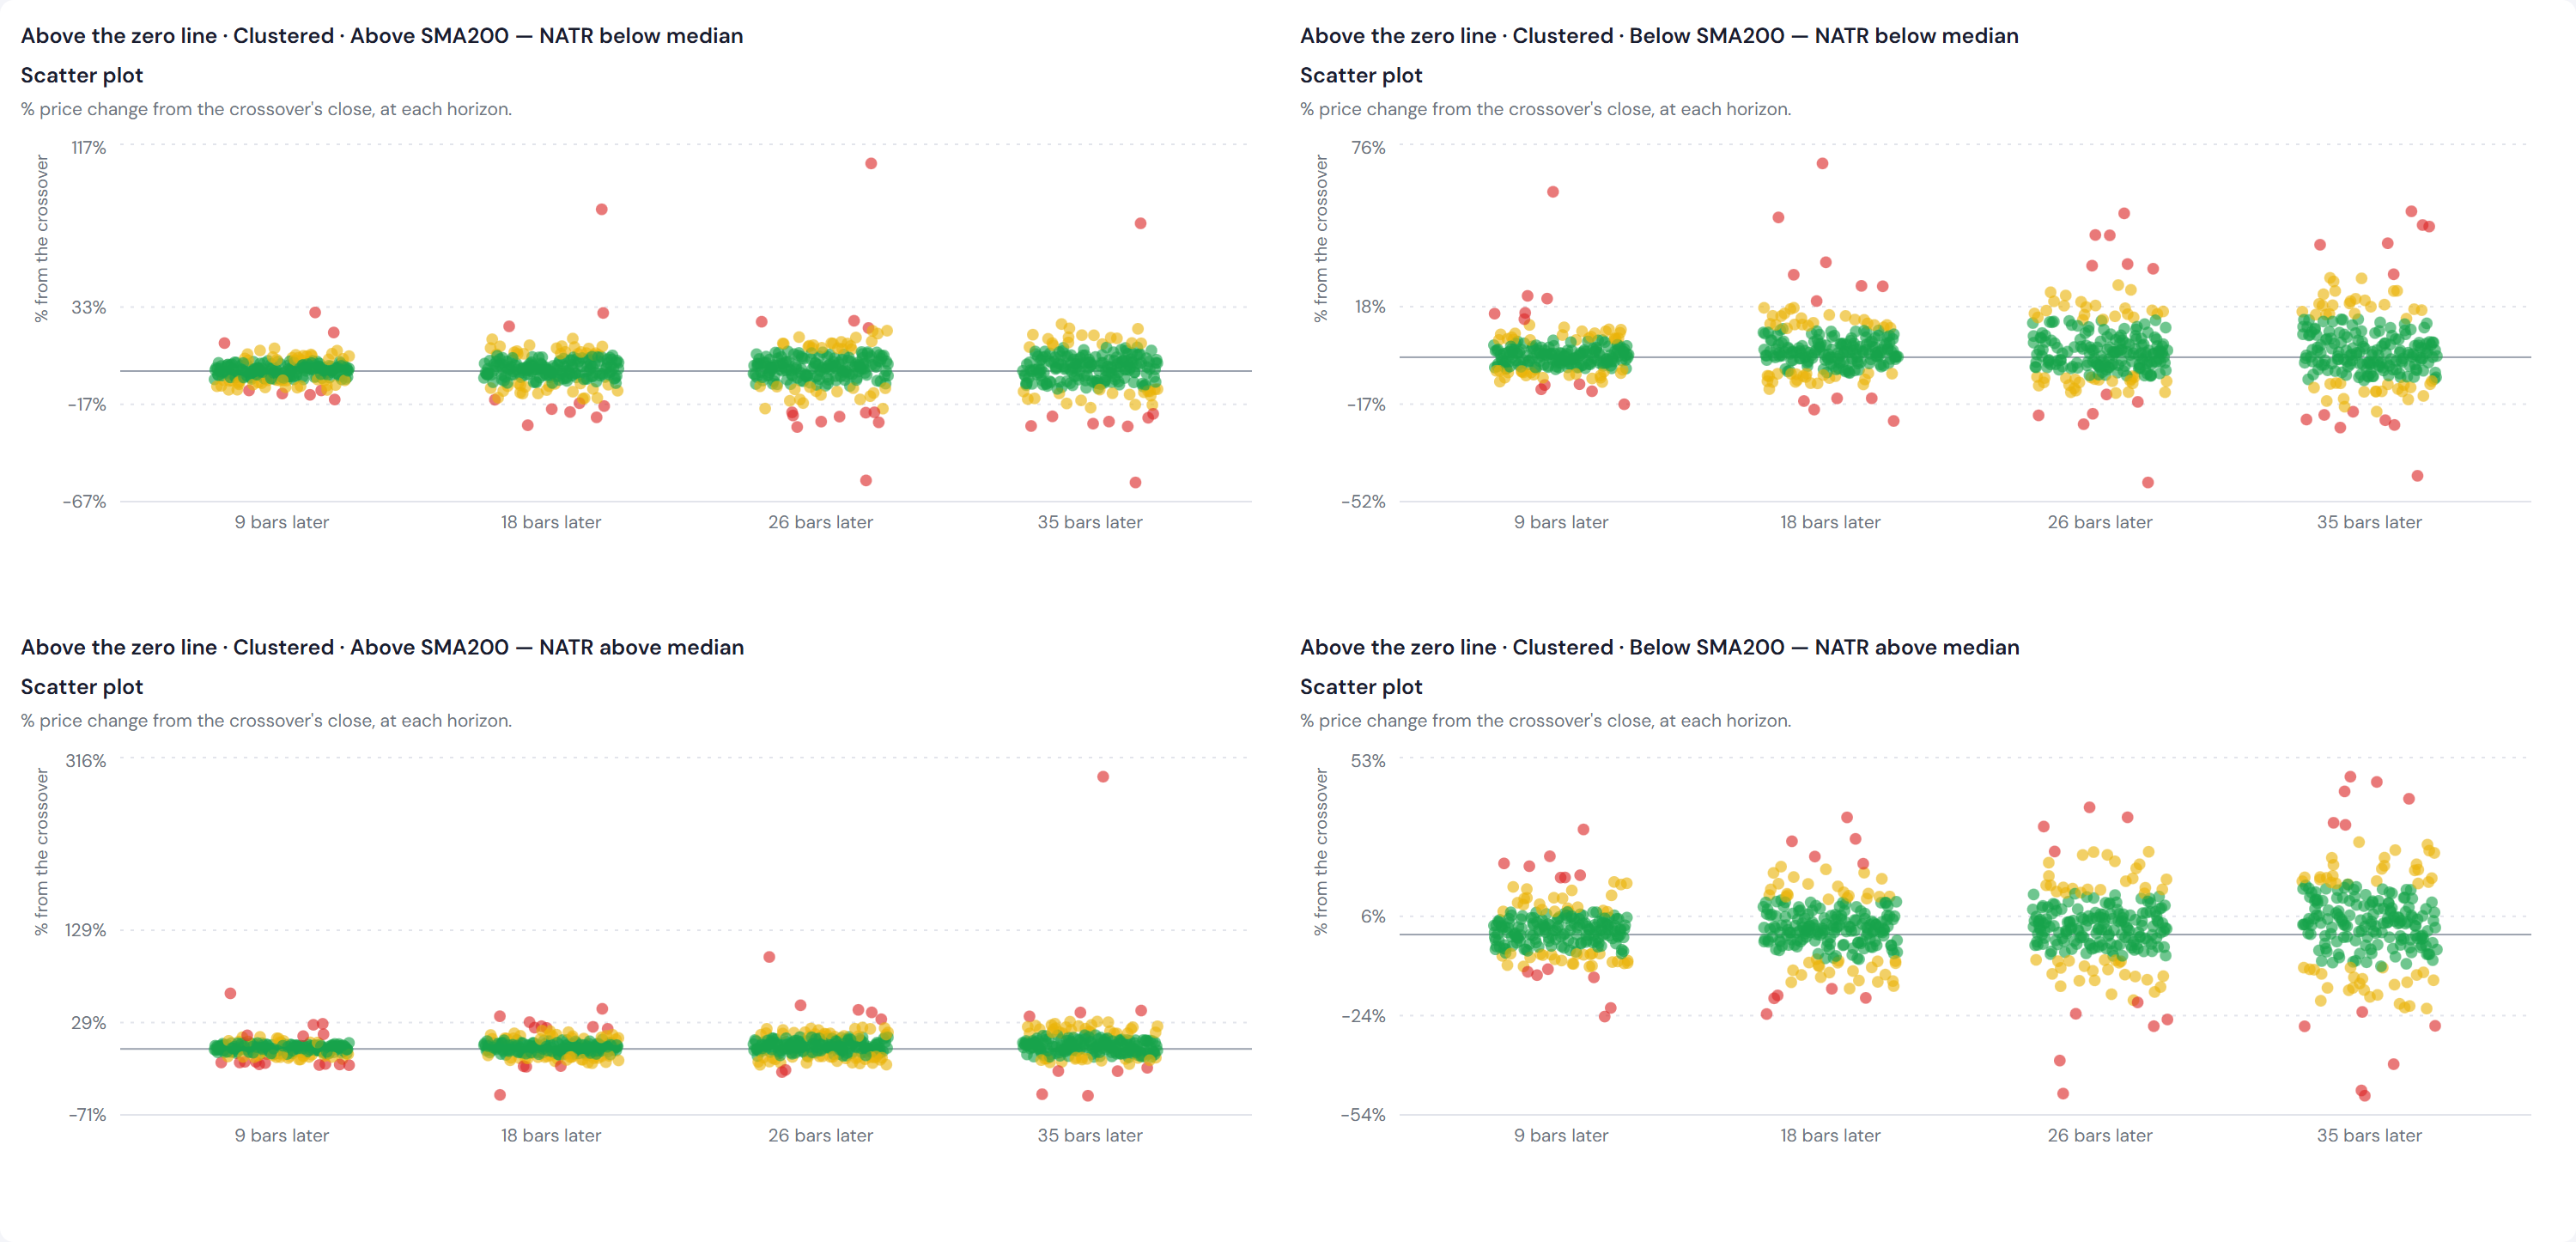
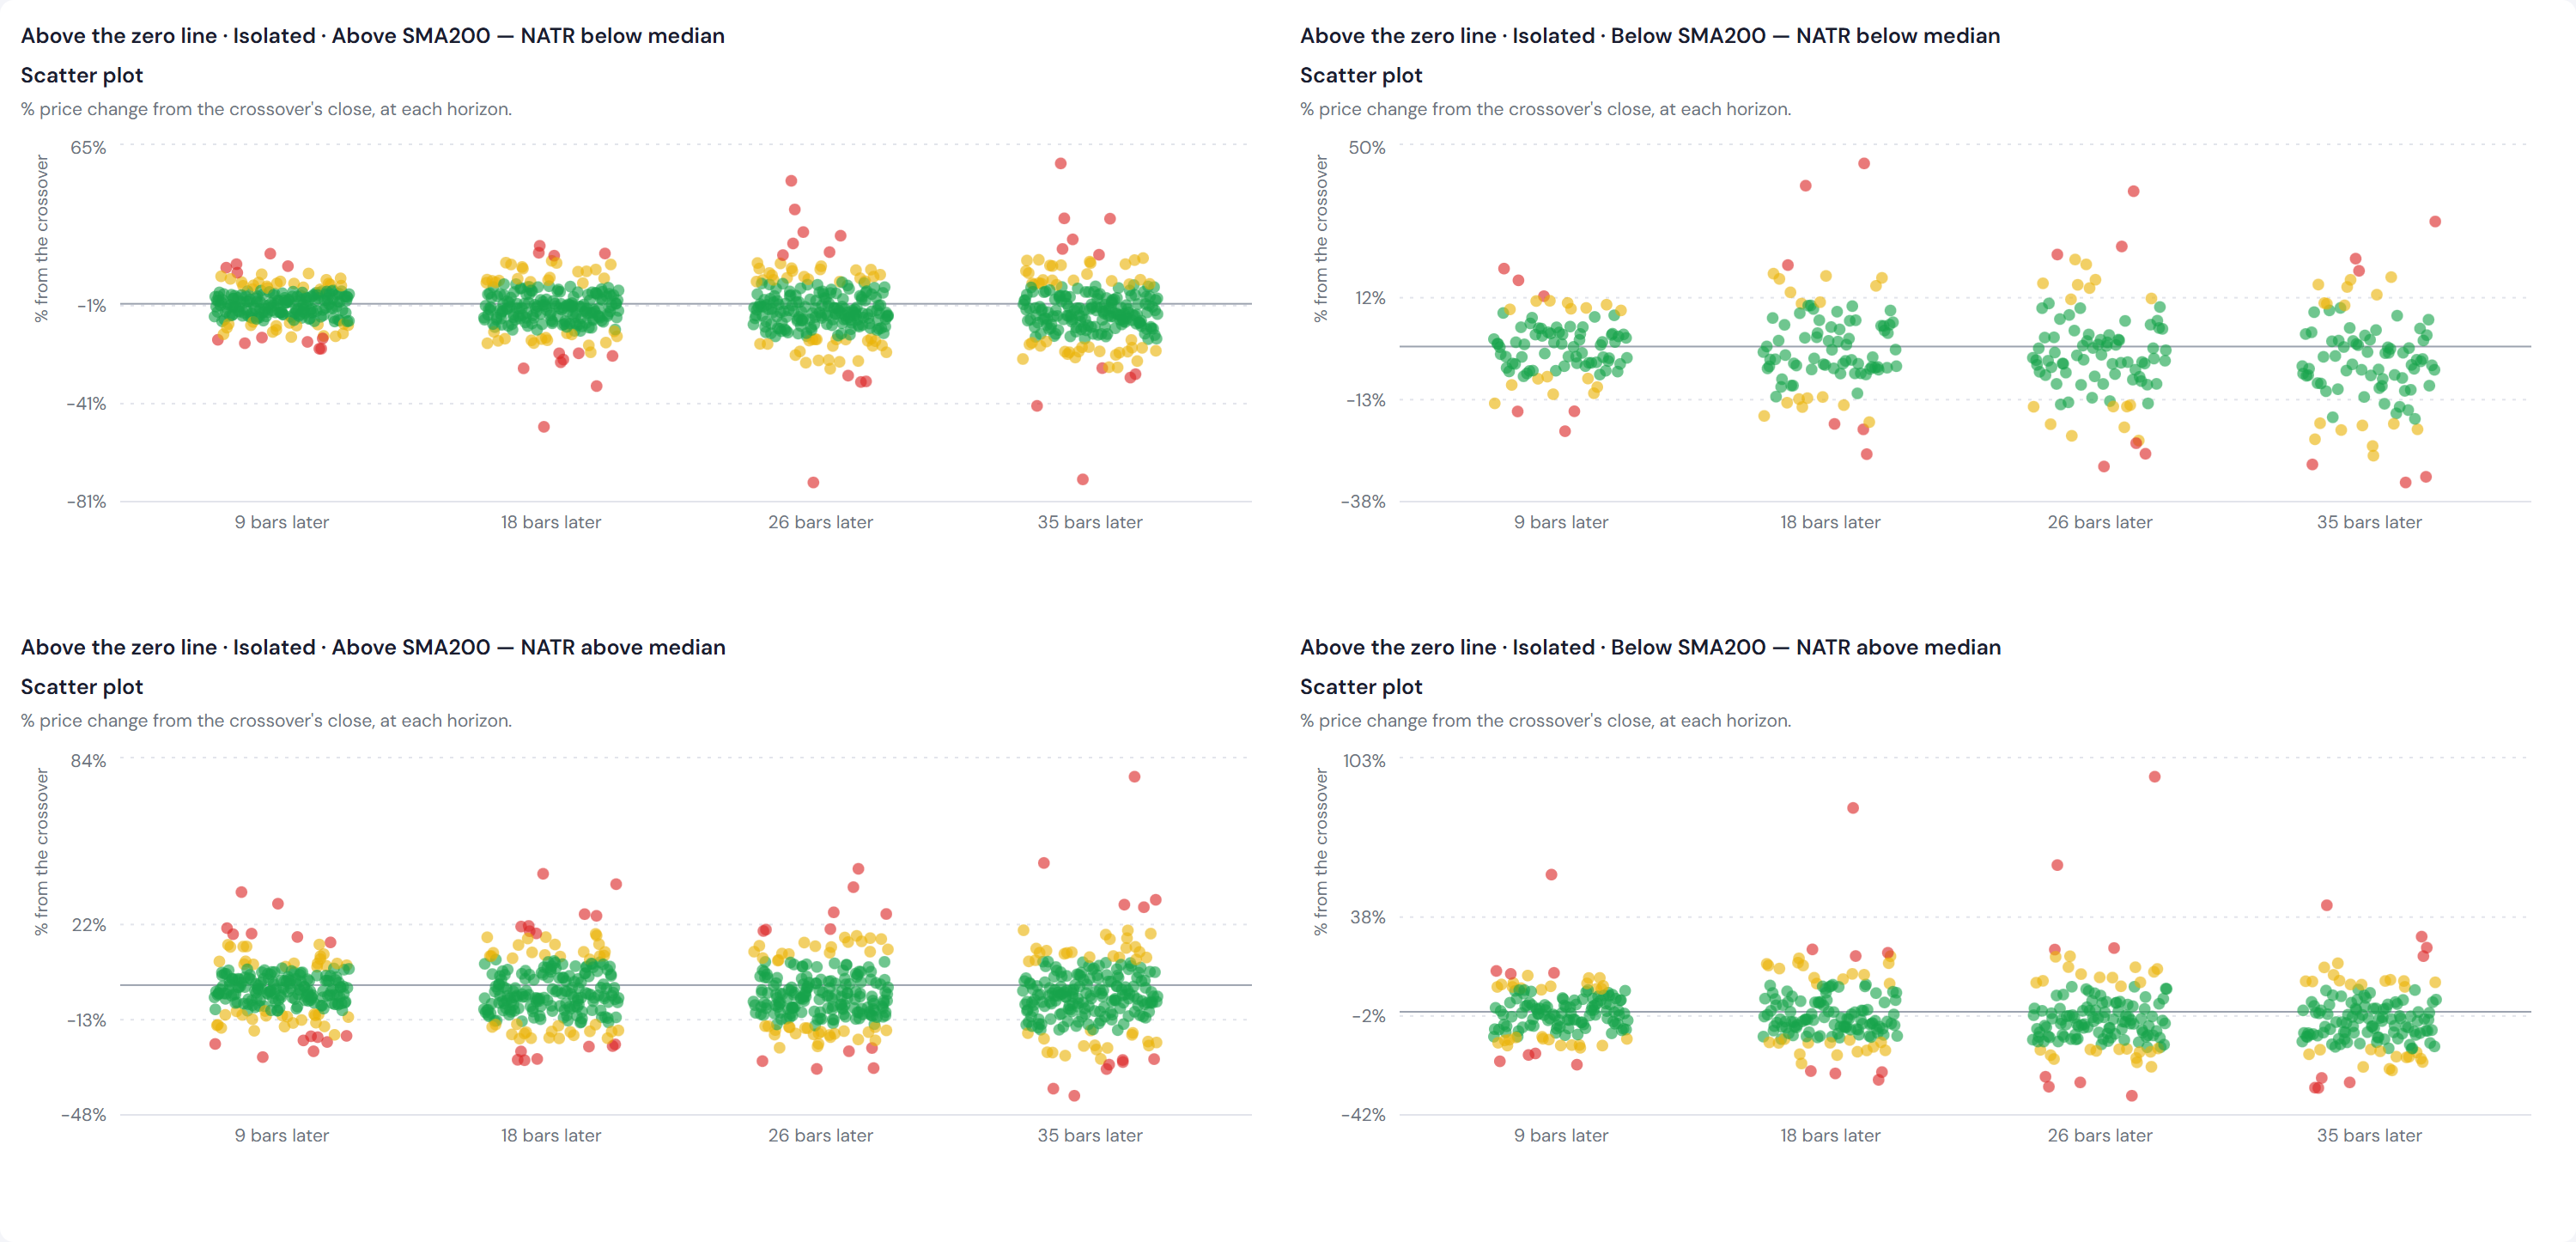
For continuity with Study 002, these figures split crossovers by whether another crossover of the same type fell on the same stock within 35 trading days on either side. The classification uses the 35 trading days after each crossover, so the figures are descriptive and sit outside the conditioned comparison.
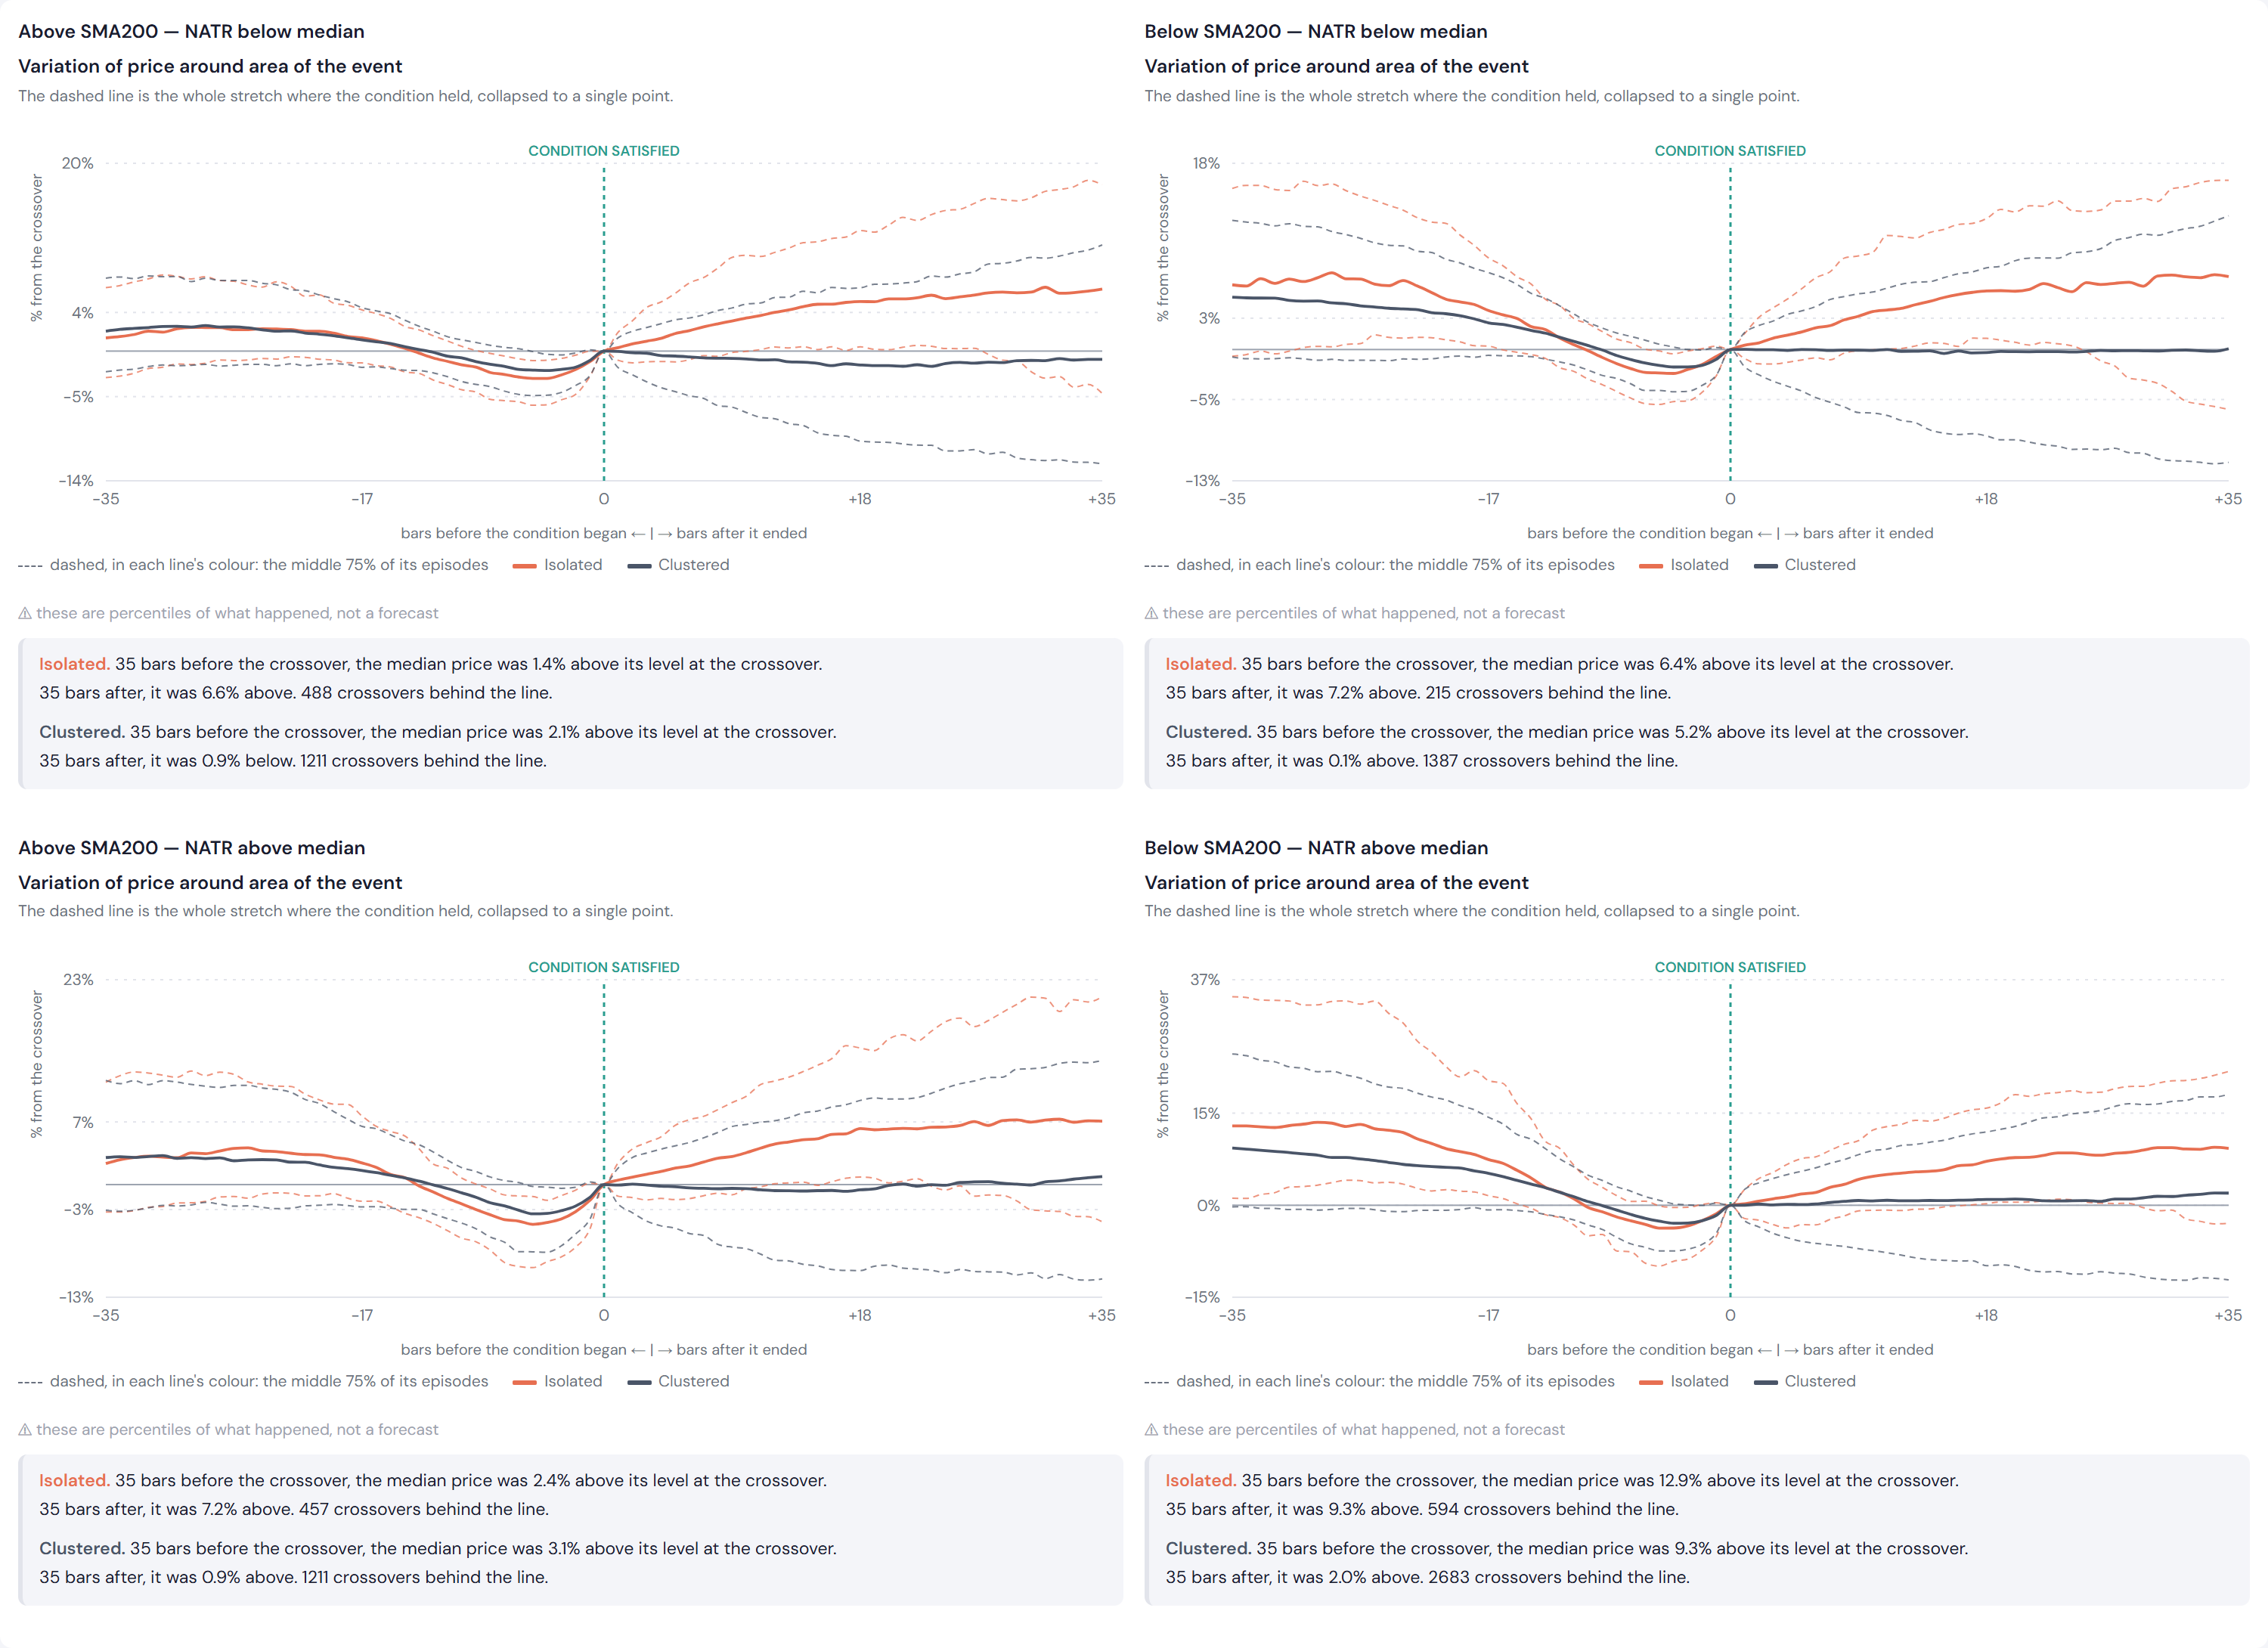
Below the zero line, the median price of crossovers classified as isolated fell over the 35 days before the crossover and rose over the 35 days after it in all four cells, by more than for clustered crossovers; 79% to 82% were higher 35 days later, against 52% to 60% of comparison days. A future study could test whether a pre-specified ex-ante characteristic identifies this subgroup, ideally with validation on data not used to select the characteristic.
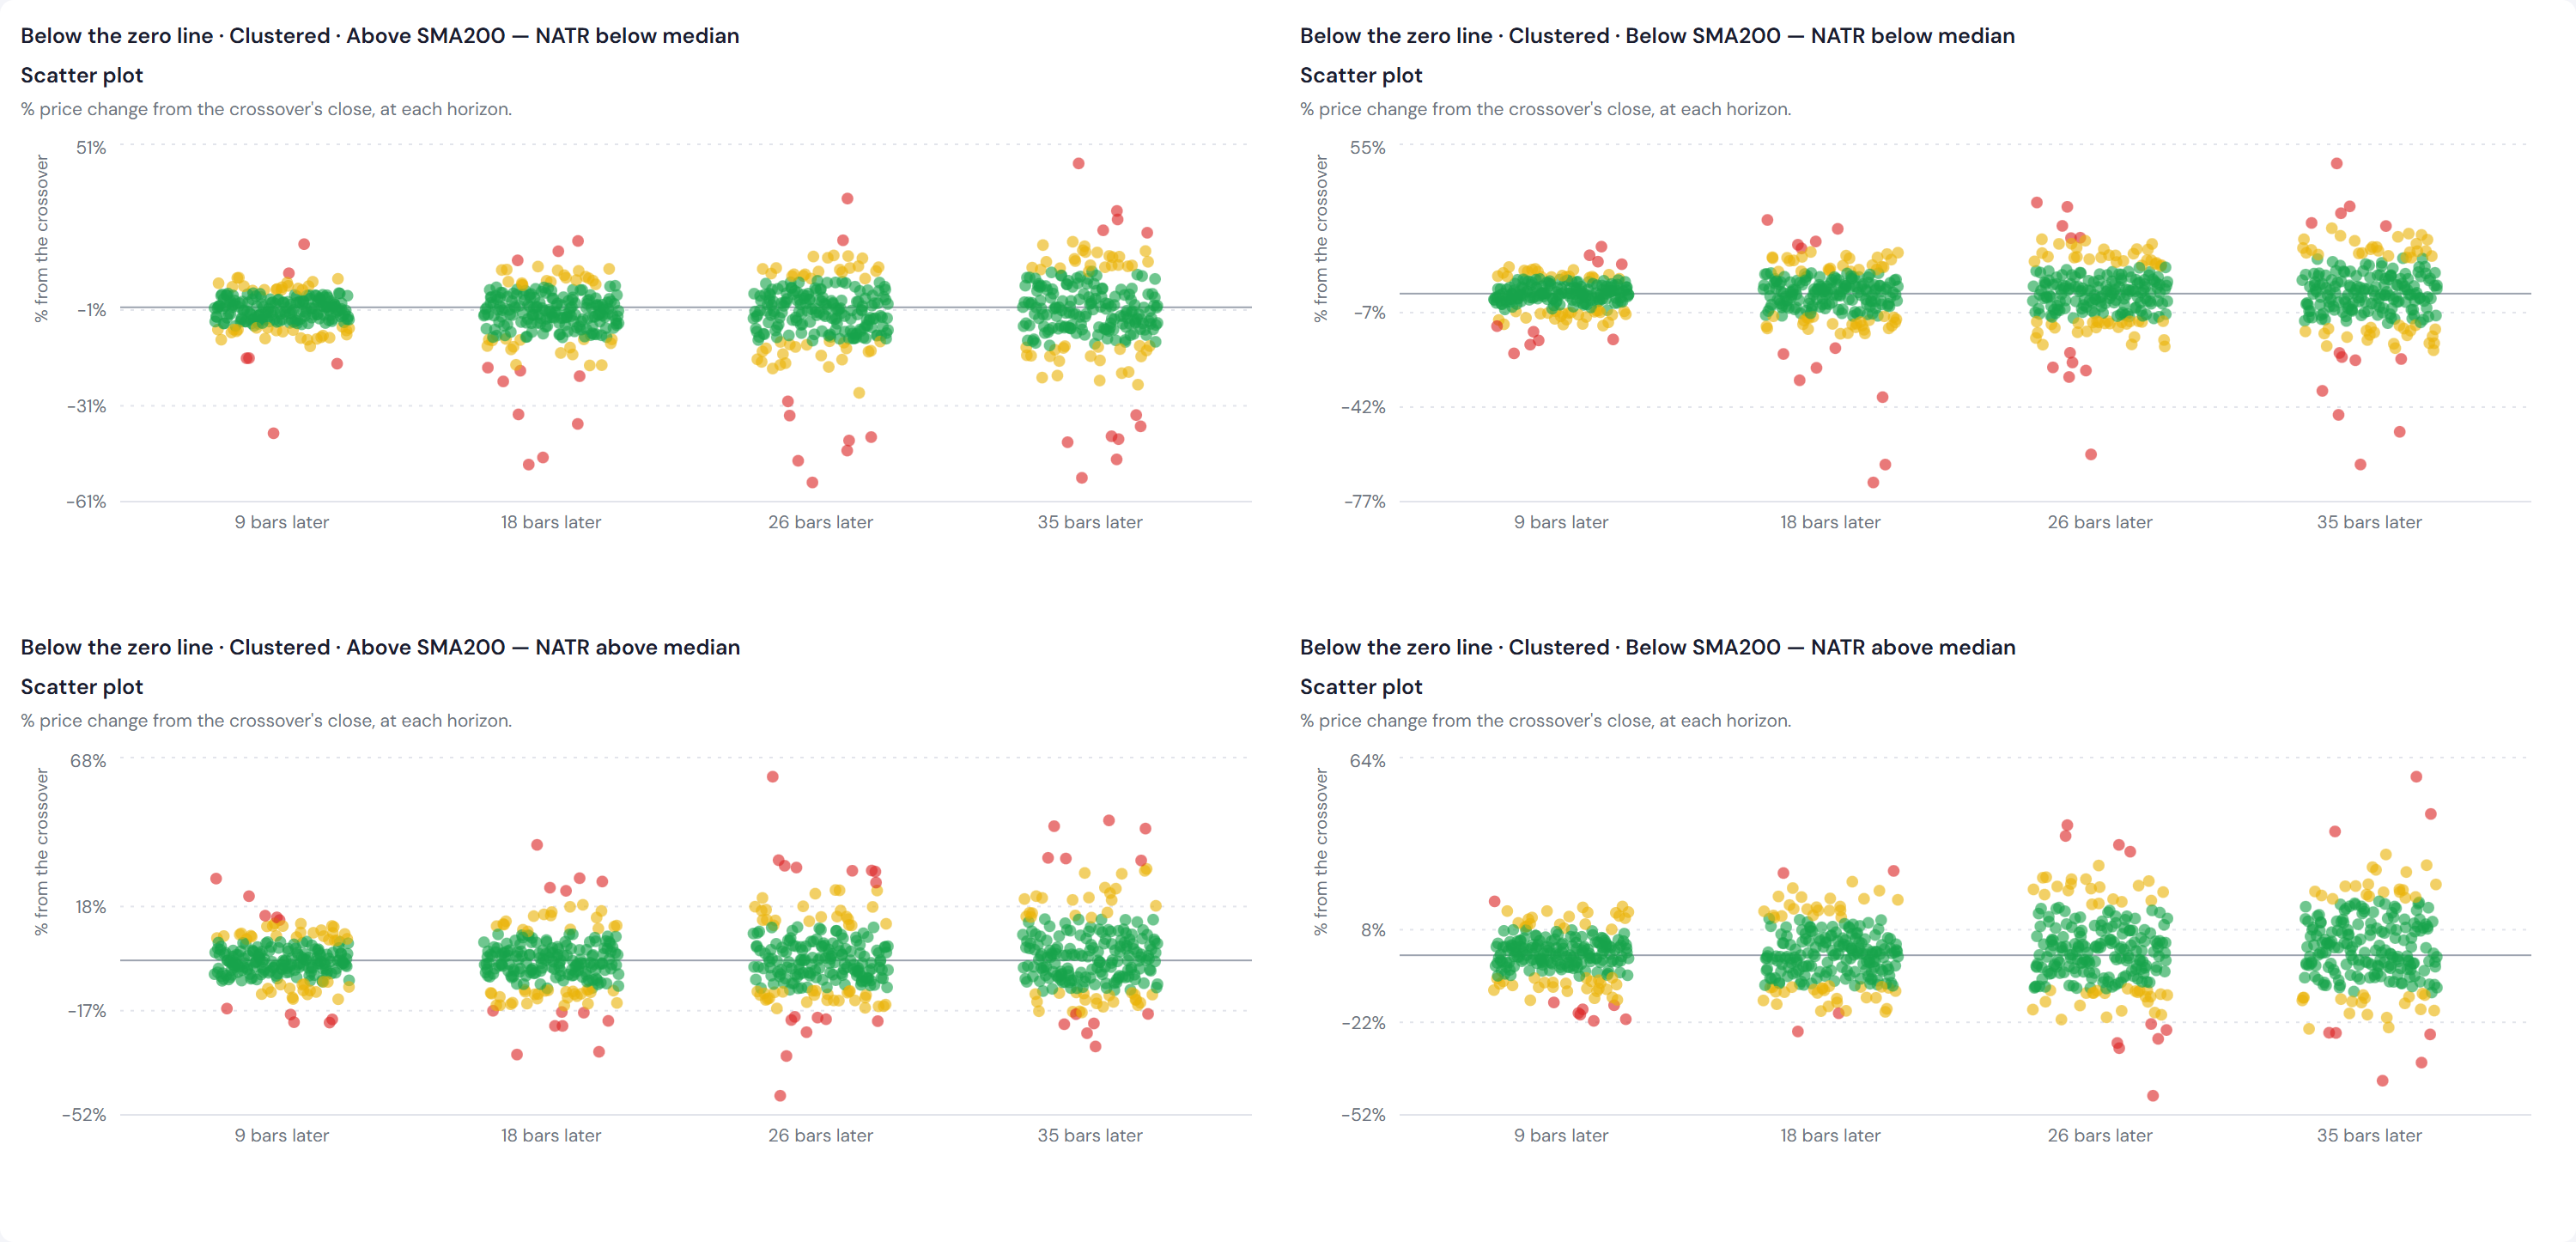
Reading these figures. Each figure is a 2×2 grid: above SMA200 on the left, below on the right; calmer than usual on top, more volatile below. The median-path charts run from 35 trading days before to 35 after the crossover, measured from its close, with isolated crossovers in orange and clustered in dark grey; dashed lines bound the middle 75% of each group. The donuts show the isolated (teal) and clustered (yellow) split. Scatter dots are single-crossover returns at 9, 18, 26 and 35 trading days, coloured green inside the middle 75% of the column, yellow inside the middle 95% and red outside it; each panel has its own vertical scale.
Median price paths
Below the zero line
Above the zero line
Below the zero line: counts and returns
Above the zero line: counts and returns
Rebuild the test
Build the same MACD crossover event across the same stocks, set the horizon to 35 days, then set the Trend and Volatility preconditions to one combination. Change the conditioning assumptions and compare the resulting benchmarks.
Create a free account and run your own event studies → or read Study 002, which this follows →