The Test Bench › Study 002
What Happens After a MACD Crossover?
15,698 bullish MACD crossovers across 197 US large-cap stocks, 2018–2026, and what price did over the 35 trading days that followed.
STUDY 002The short version
A bullish MACD crossover was followed by much the same return as the comparison days.
Median return over the next 35 trading days: 1.85% after a crossover, 1.94% after the comparison days in the same stocks. Price finished higher roughly 57% of the time in both cases.
One group looked better at first glance: below-zero crossovers with no other below-zero crossover in the 35 days on either side. Price had fallen -4.25% before and rose 7.62% after.
We tested that group and it fell apart. The definition needs quiet on both sides of the event, and only the earlier side could have been known on the day. Using that side alone, the median drops to 2.27% — below the 2.47% for below-zero crossovers as a whole. The difference comes from the later side of the definition, which had not happened yet.
A historical analysis of what happened in the tested data. It is not advice and does not predict future returns.
Full research: method, results and limitations
Every table, figure and assumption behind the summary above
The question
Does price behave differently after a bullish MACD crossover than after other trading days in the same stocks over the same period?
What a MACD crossover is
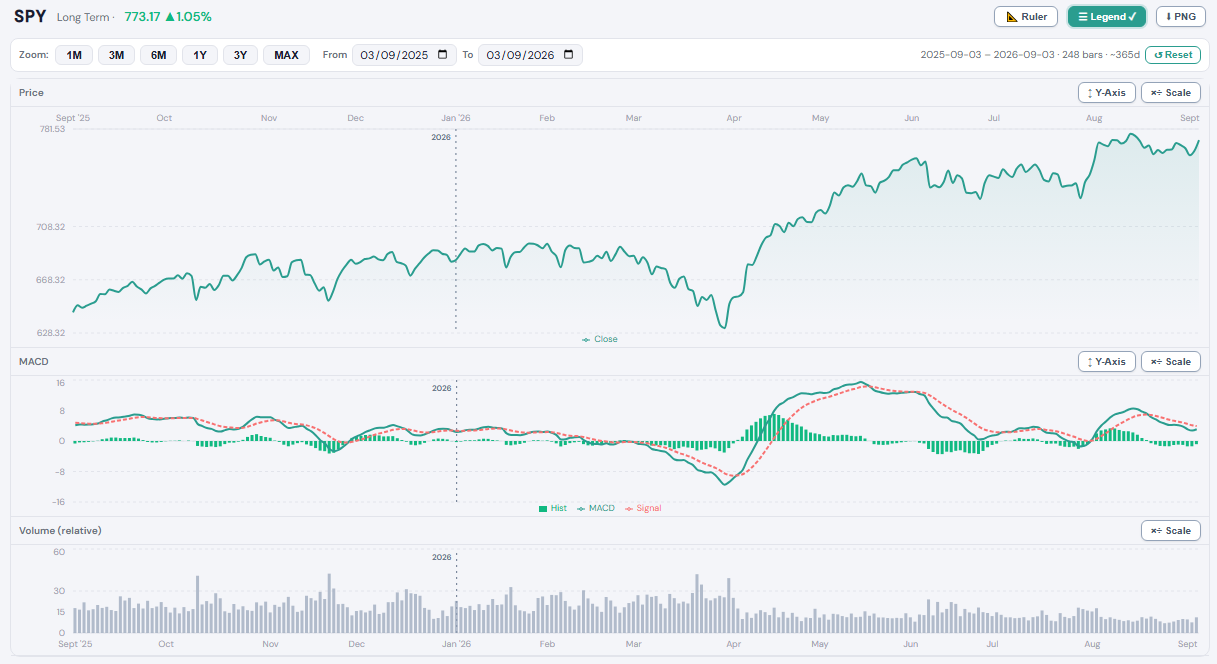
MACD uses two exponential moving averages of the closing price: a 12-day EMA and a 26-day EMA. The MACD line is the difference between them. The signal line is a 9-day EMA of the MACD line.
A bullish crossover occurs when the MACD line moves above the signal line. The MACD line is above zero when the 12-day EMA is above the 26-day one, and below zero when it is under it. This study tests bullish signal-line crossovers.
The test
- Universe. 197 US large-cap stocks.
- Period. 2018-03-12 to 2026-09-03, daily bars.
- Indicator. MACD 12 / 26 / 9, unchanged throughout.
- Event. A bar on which the MACD line closes above the signal line, having closed at or below it on the previous bar. 15,698 events.
- Outcome. The return from the crossover bar's close to the close 35 trading days later. 15,429 events have a full 35-day window; the rest fall too close to the end of a stock's history and are excluded.
- Comparison days. The same forward-return measure calculated from every eligible trading day in the same stocks over the same period — 389,270 observations. It is an unconditional baseline, not a matched control: it asks what followed a trading day in these stocks generally. Crossover days are among them, at 4.0% of the total. Both the event windows and the comparison windows overlap one another.
This measures what happened after the crossover. It does not simulate buying at a crossover and exiting on a rule, and there is no position sizing, holding period or transaction cost anywhere in it.
The sample covers a generally rising period. A positive return after a crossover is therefore not evidence of a crossover effect by itself, which is why every figure is compared with the same forward-return measure taken from the comparison days.
What happened after the crossover
Across 15,698 bullish crossovers the median return over the following 35 trading days was 1.85%. The comparison days gave 1.94%. Price was higher 35 days later after 57.0% of crossovers and 57.4% of comparison days.
Resampling the crossover events in contiguous calendar blocks gives a 95% range of 0.94% to 2.77% for the crossover median. The 1.94% comparison-day median falls inside that range. This resampling does not show a clear difference between the two.
The same holds at shorter horizons. At 9 trading days the figures are 0.65% against 0.60%; at 18 days, 1.13% against 1.10%; at 26 days, 1.49% against 1.52%. The 35-day horizon is the app's default and was fixed before the run.
Crossovers occur frequently. The median gap between them is 23 trading days and three quarters of the gaps are 34 days or fewer, so the 35-day windows around neighbouring events overlap. Repeated crossovers in the same stock are not independent observations.
Splitting by zero line and by isolation
The crossovers were split two ways. First by whether the MACD line was above or below zero when the crossover happened. Second by whether the crossover was isolated.
An isolated crossover has no other crossover of the same kind in the same stock during the preceding or following 35 trading days. Within the below-zero group that means no other below-zero crossover; within the above-zero group, no other above-zero crossover; and across all crossovers, no other crossover at all. Those are different conditions, so the counts below are not subsets of one another and do not sum.
| Group | Events | Isolated — and from what | Prior 35 days | Following 35 days |
|---|---|---|---|---|
| Below zero — all | 8,565 | 1,847 with no other below-zero crossover nearby (21.6%) | -4.89% | 2.47% |
| Below zero — isolated | 1,847 | — | -4.25% | 7.62% |
| Below zero — clustered | 6,718 | — | -5.02% | 0.78% |
| Above zero — all | 7,133 | 1,260 with no other above-zero crossover nearby (17.7%) | 8.88% | 1.22% |
| Above zero — isolated | 1,260 | — | 9.22% | -3.97% |
| Above zero — clustered | 5,873 | — | 8.79% | 2.26% |
| All crossovers | 15,698 | 944 with no other crossover of any kind nearby (6.0%) | 1.16% | 1.85% |
An example of why the isolated counts do not sum. A crossover can have no other below-zero crossover within 35 days while an above-zero one sits three days away: isolated in the first row, not in the last. Of the 1,847 below-zero isolated crossovers, 687 are also isolated among all crossovers; of the 1,260 above-zero ones, 257 are. Those two figures make up the 944 in the bottom row exactly.
Isolation is defined using both the preceding and the following 35 trading days. The isolated rows therefore use information that was not available on the crossover day.
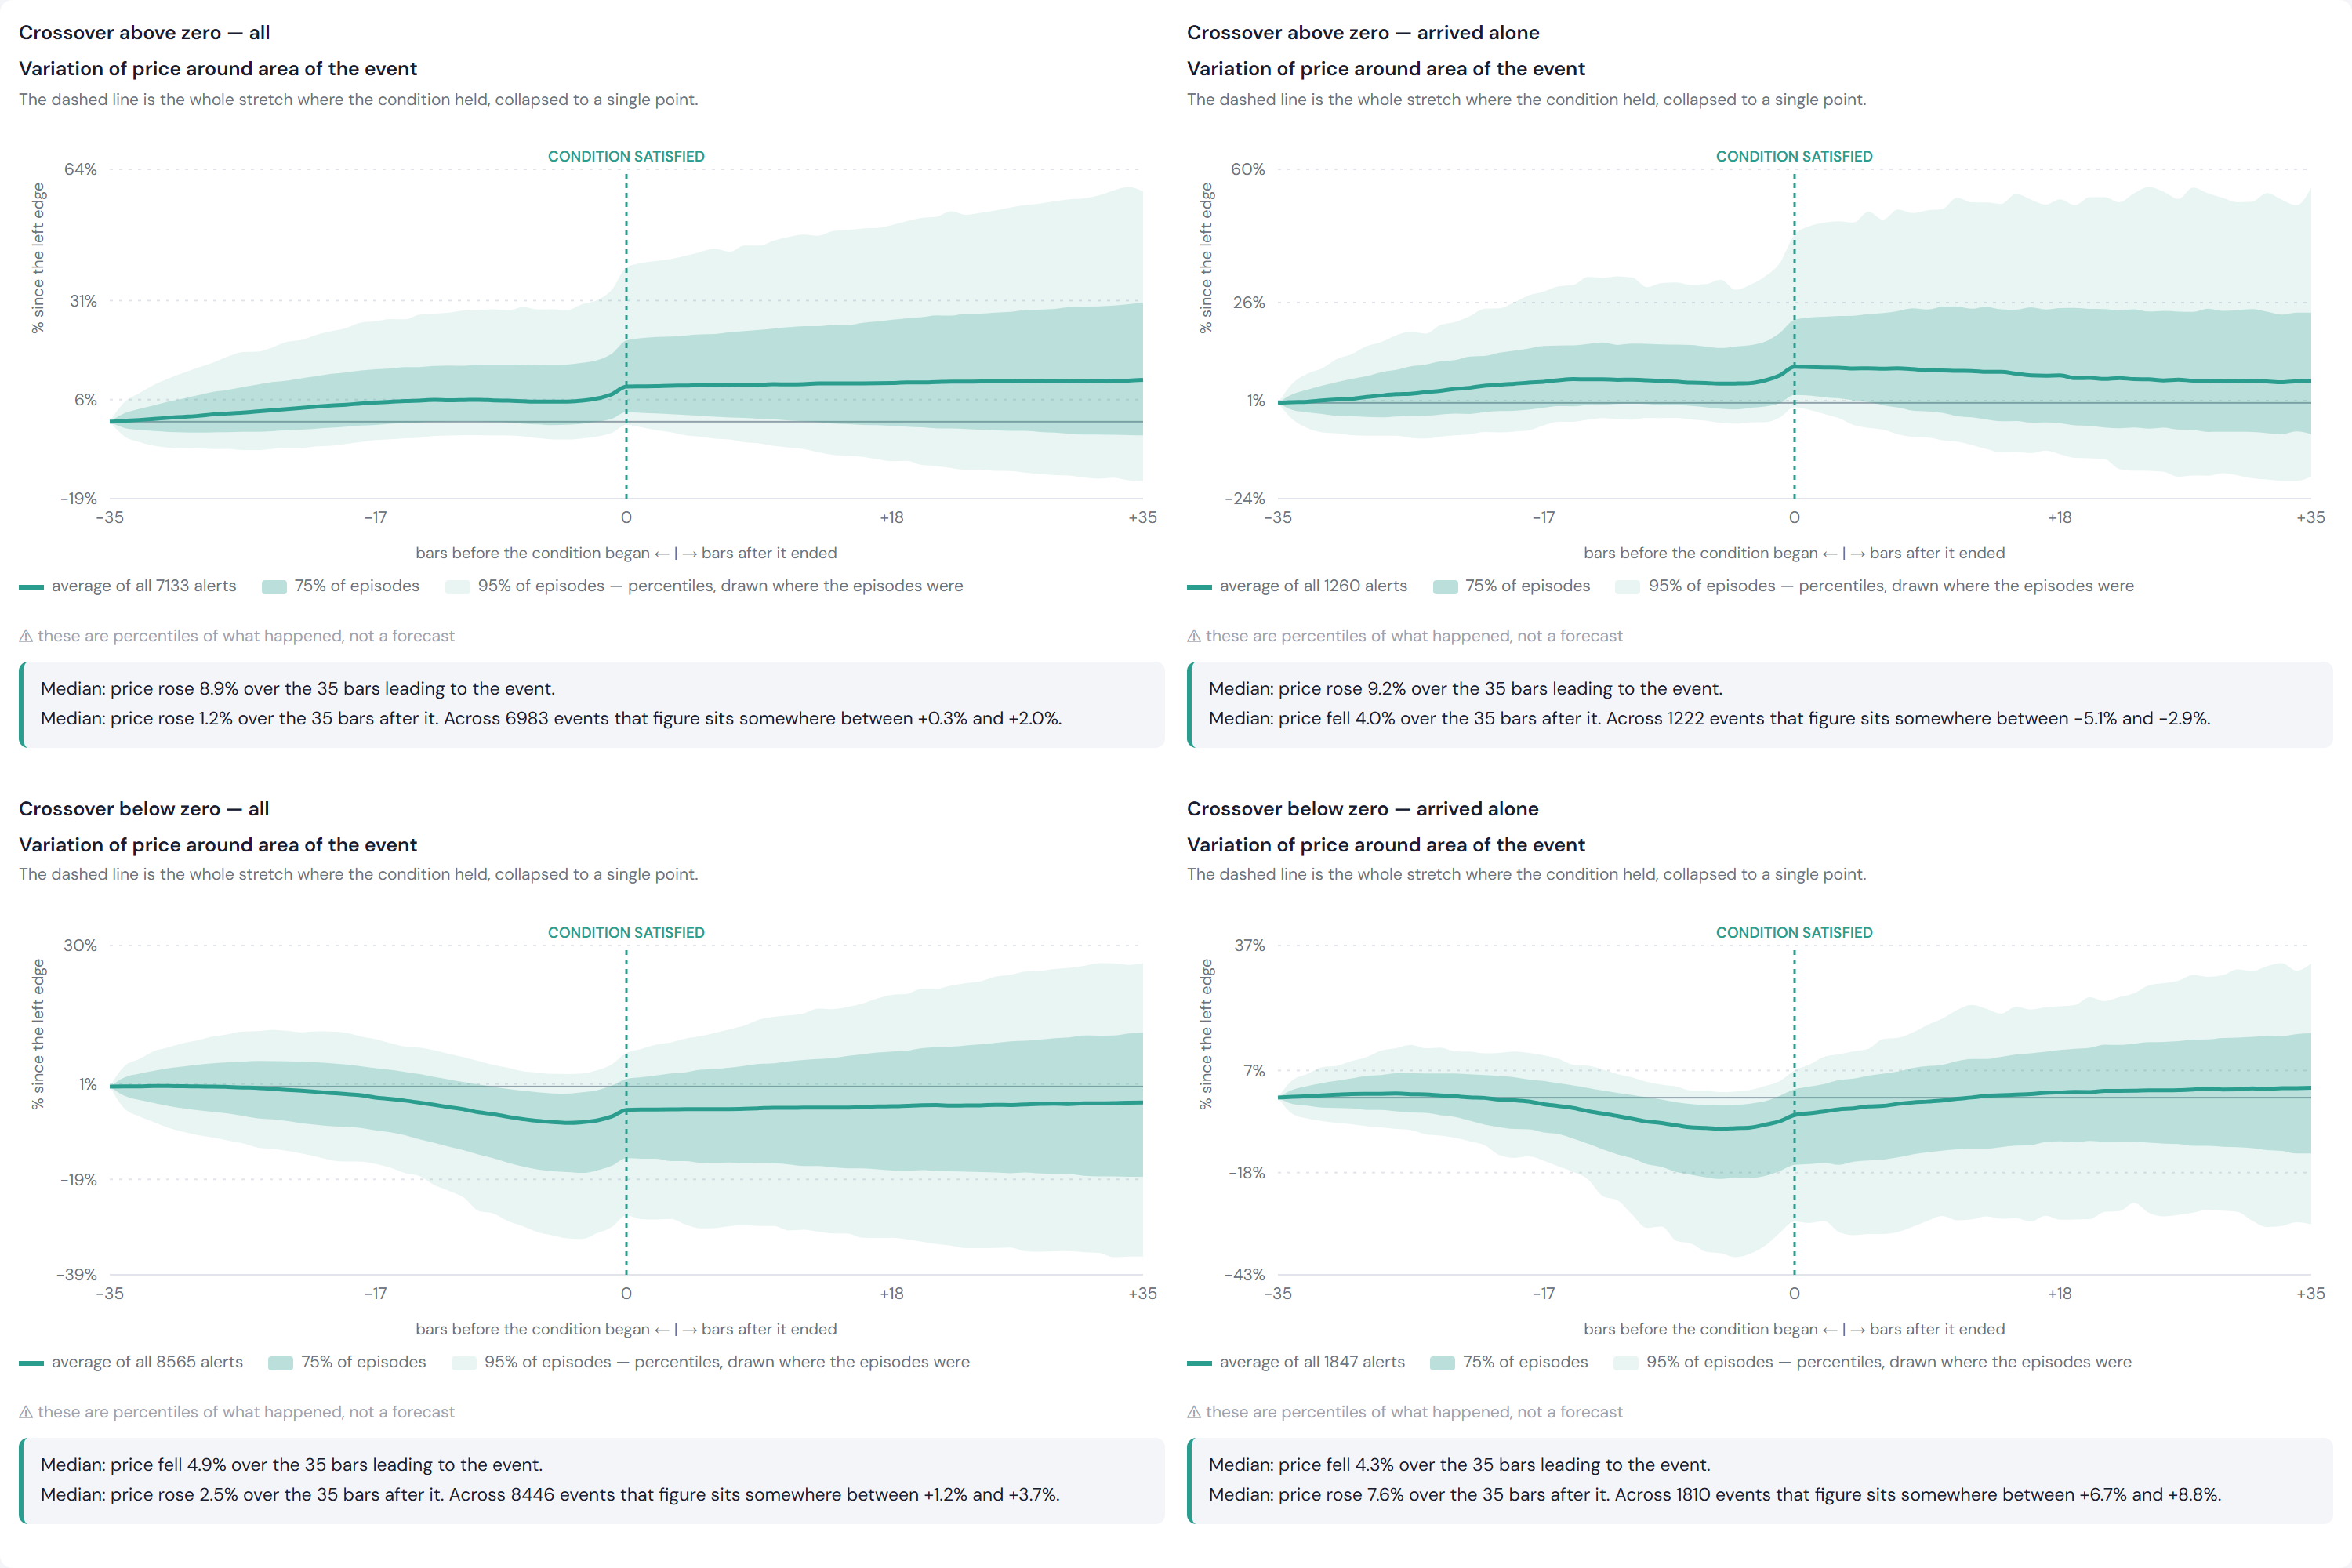
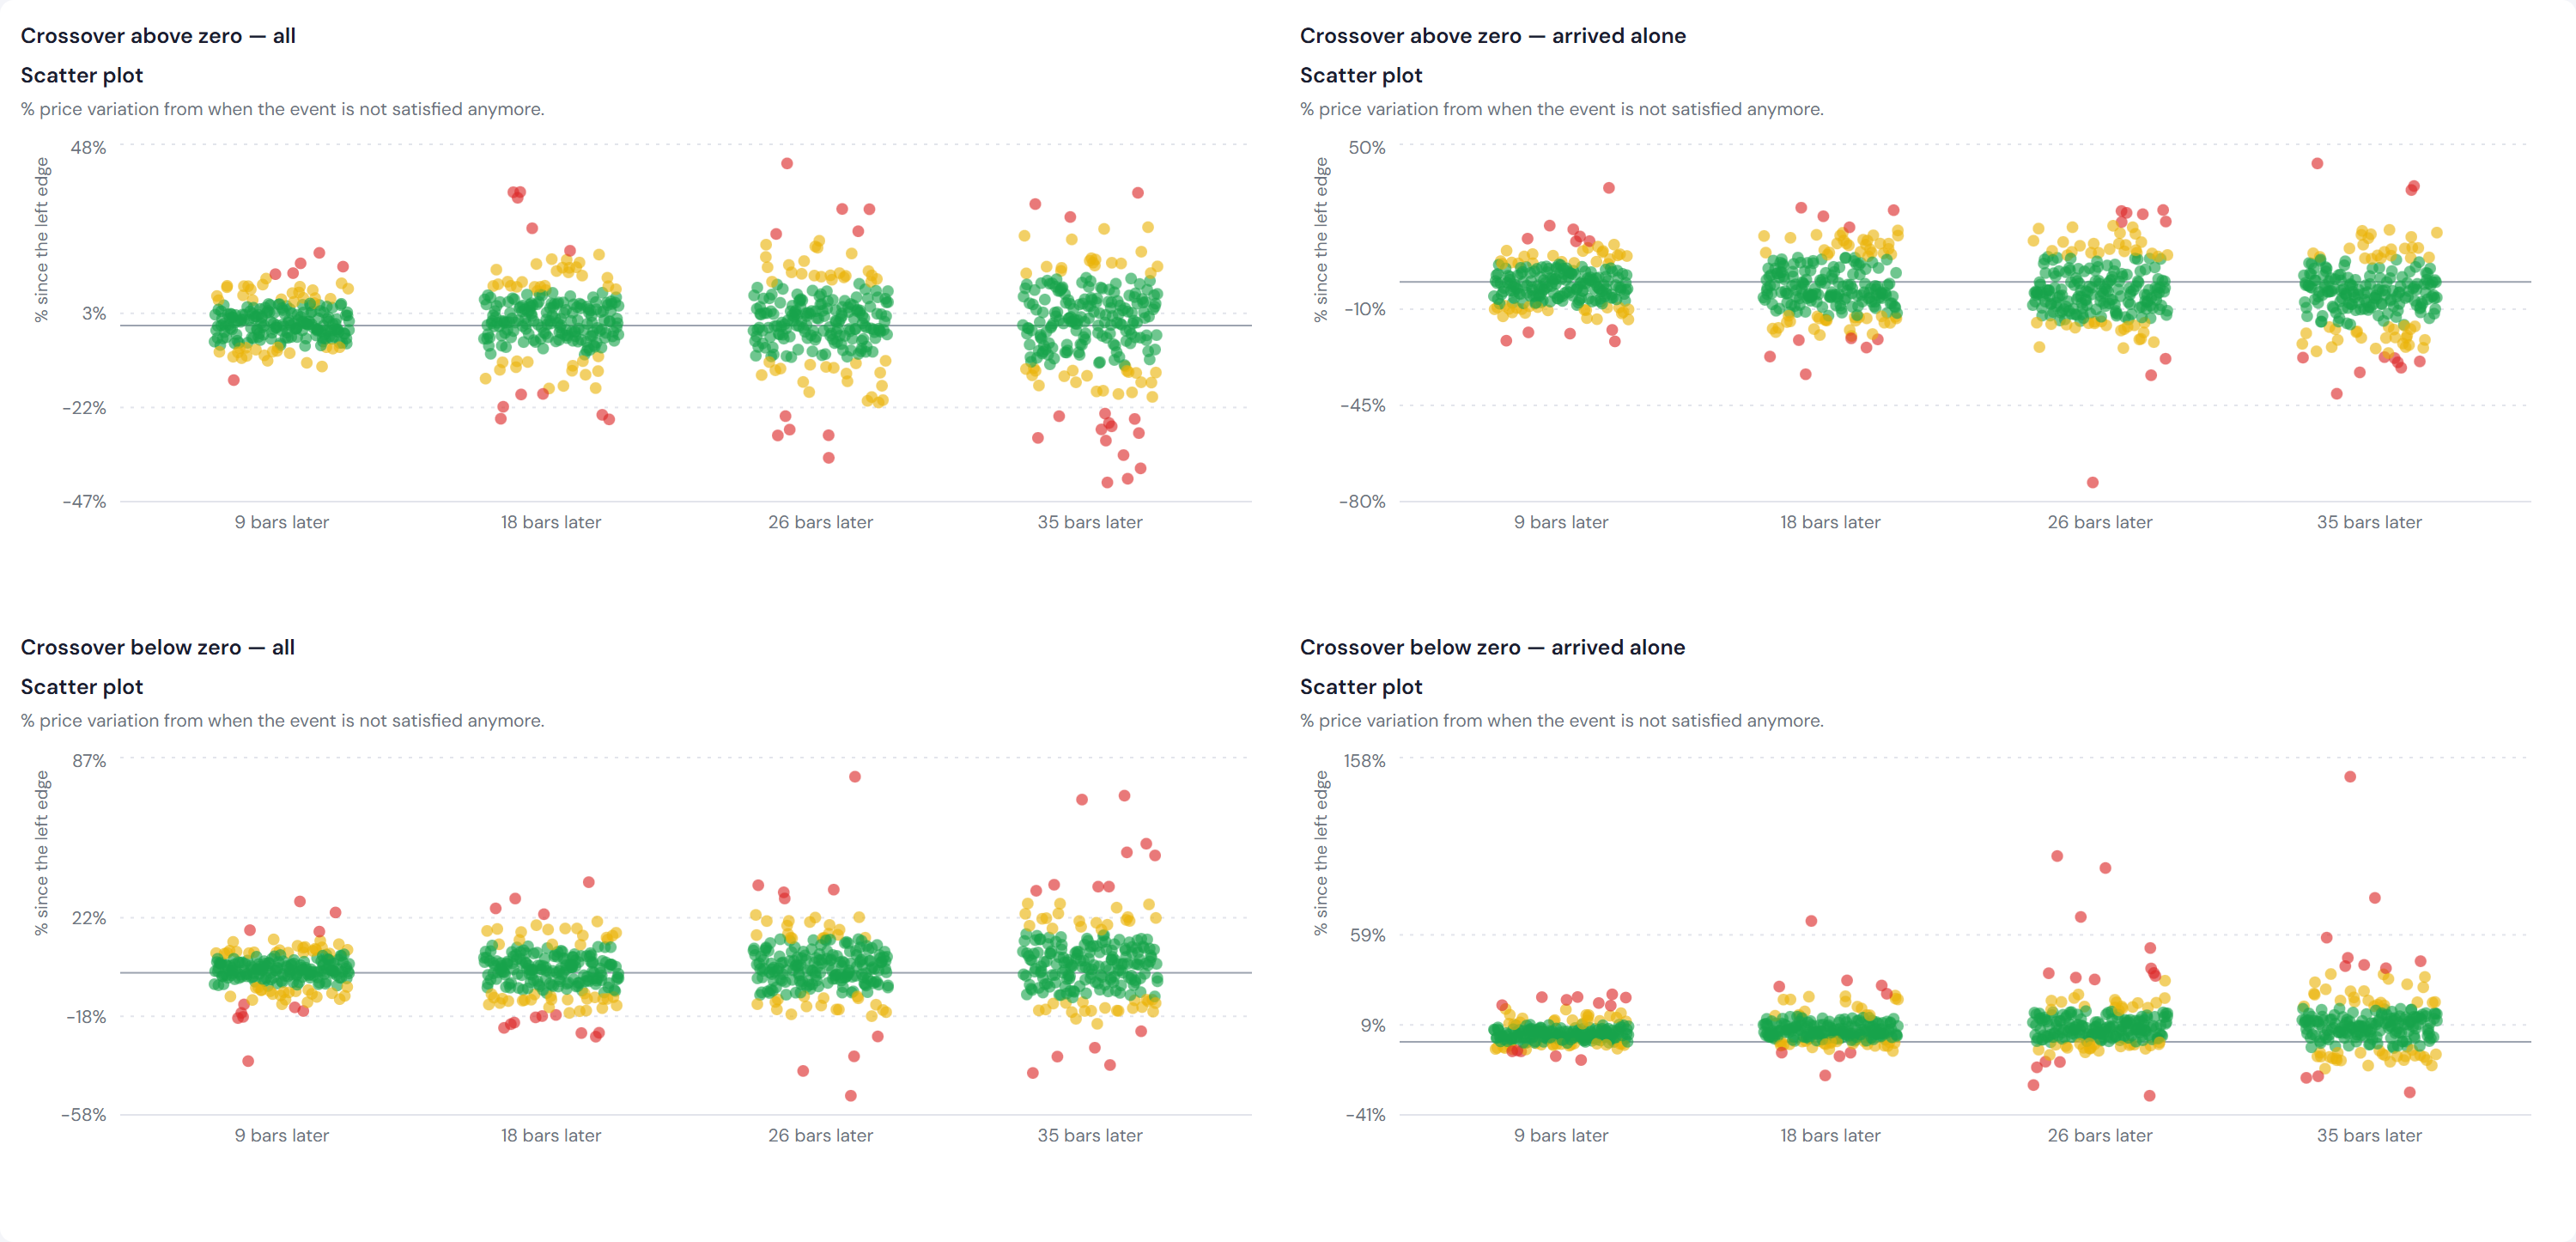
The differences between the isolated and clustered groups are much larger than the overall difference between crossover and comparison days. Below-zero isolated crossovers were preceded by a fall of -4.25% and followed by a rise of 7.62%. Above-zero isolated crossovers were preceded by a rise of 9.22% and followed by -3.97%. In both cases the median price path changes direction around the event.
The below-zero isolated group had already fallen substantially before the crossover. This study does not establish whether the crossover itself, the preceding decline, or their combination accounts for the difference. The clustered below-zero crossovers came after a similar fall of -5.02% and rose 0.78%, which is a comparison within this sample rather than a test that holds the prior move constant.
Crossovers isolated from every other crossover were 6.0% of all events.

Testing whether the isolated result is real
The isolated group is defined by two conditions: no other below-zero crossover in the 35 trading days before the event, and none in the 35 days after. Only the first is knowable on the day. We ran the two halves separately.
Counts in this table are smaller than elsewhere in the study. Measuring a forward return needs 35 bars after the event (8,565 below-zero crossovers become 8,446); this test also needs 35 bars before it, to measure the prior move, which leaves 8,246. The same rule applies to every row here.
| Below-zero crossovers | Events | Prior 35 days | Following 35 days | Rose |
|---|---|---|---|---|
| All | 8,246 | −4.89% | +2.47% | 58.7% |
| No crossover in the previous 35 days — knowable on the day | 3,780 | −4.48% | +2.27% | 58.7% |
| No crossover in the following 35 days — not knowable | 3,790 | −4.76% | +8.00% | 79.5% |
| Both conditions — the isolated group above | 1,754 | −4.25% | +7.71% | 80.3% |
The condition that was knowable on the day contributed essentially nothing. The entire observed difference was produced by the condition that was not.
Requiring a quiet 35 days before the crossover moves the median by −0.20 percentage points. Requiring a quiet 35 days after it moves the median by +5.53 points and lifts the share of positive outcomes from 58.7% to 79.5%.
The selection works through the definition itself. A second bullish crossover requires the MACD line to fall back below its signal line and then cross above it again. Requiring no second crossover for 35 days therefore selects periods in which that sequence did not occur, and the return is measured over those same 35 days.
The 7.62% therefore comes from a group defined partly by what happened after the event.
Splitting the same events by the size of their prior move, into five buckets, leaves the isolated-versus-clustered gap almost unchanged: a median of +6.80 percentage points within buckets against +6.93 across all of them, and positive in every bucket including the one where price had risen beforehand. Stratifying by the prior move leaves the gap in place. What removes it is dropping the forward-looking half of the isolation condition.
Volume does not separate the groups
The isolated and clustered groups also differ in volume on the day of the crossover, which raised the question of whether volume identifies the same events without needing the future. It does not. Splitting the volume figure the same way splits the return figure puts the difference in the same place.
| Below-zero crossovers | Events | Volume on the day | Following 35 days |
|---|---|---|---|
| All | 8,246 | 1.019× | +2.47% |
| Quiet 35 days before — knowable | 3,780 | 1.003× | +2.27% |
| ...and everything else | 4,466 | 1.031× | +2.59% |
| Quiet 35 days after — not knowable | 3,790 | 1.050× | +8.00% |
| ...and everything else | 4,456 | 0.995× | −2.06% |
On the knowable condition, median event-day volume was 1.003× normal against 1.031× for the rest. The volume gap, like the return gap, sits in the forward-looking half of the definition.
Volume is expressed relative to that event's own median volume over the 35 trading days before it, so 1.00 is that stock's own recent level. The headline results in this study use medians. The panels below use the engine's mean of the same ratio, because they show the underlying Event Analysis metrics. The two summaries are not directly comparable.
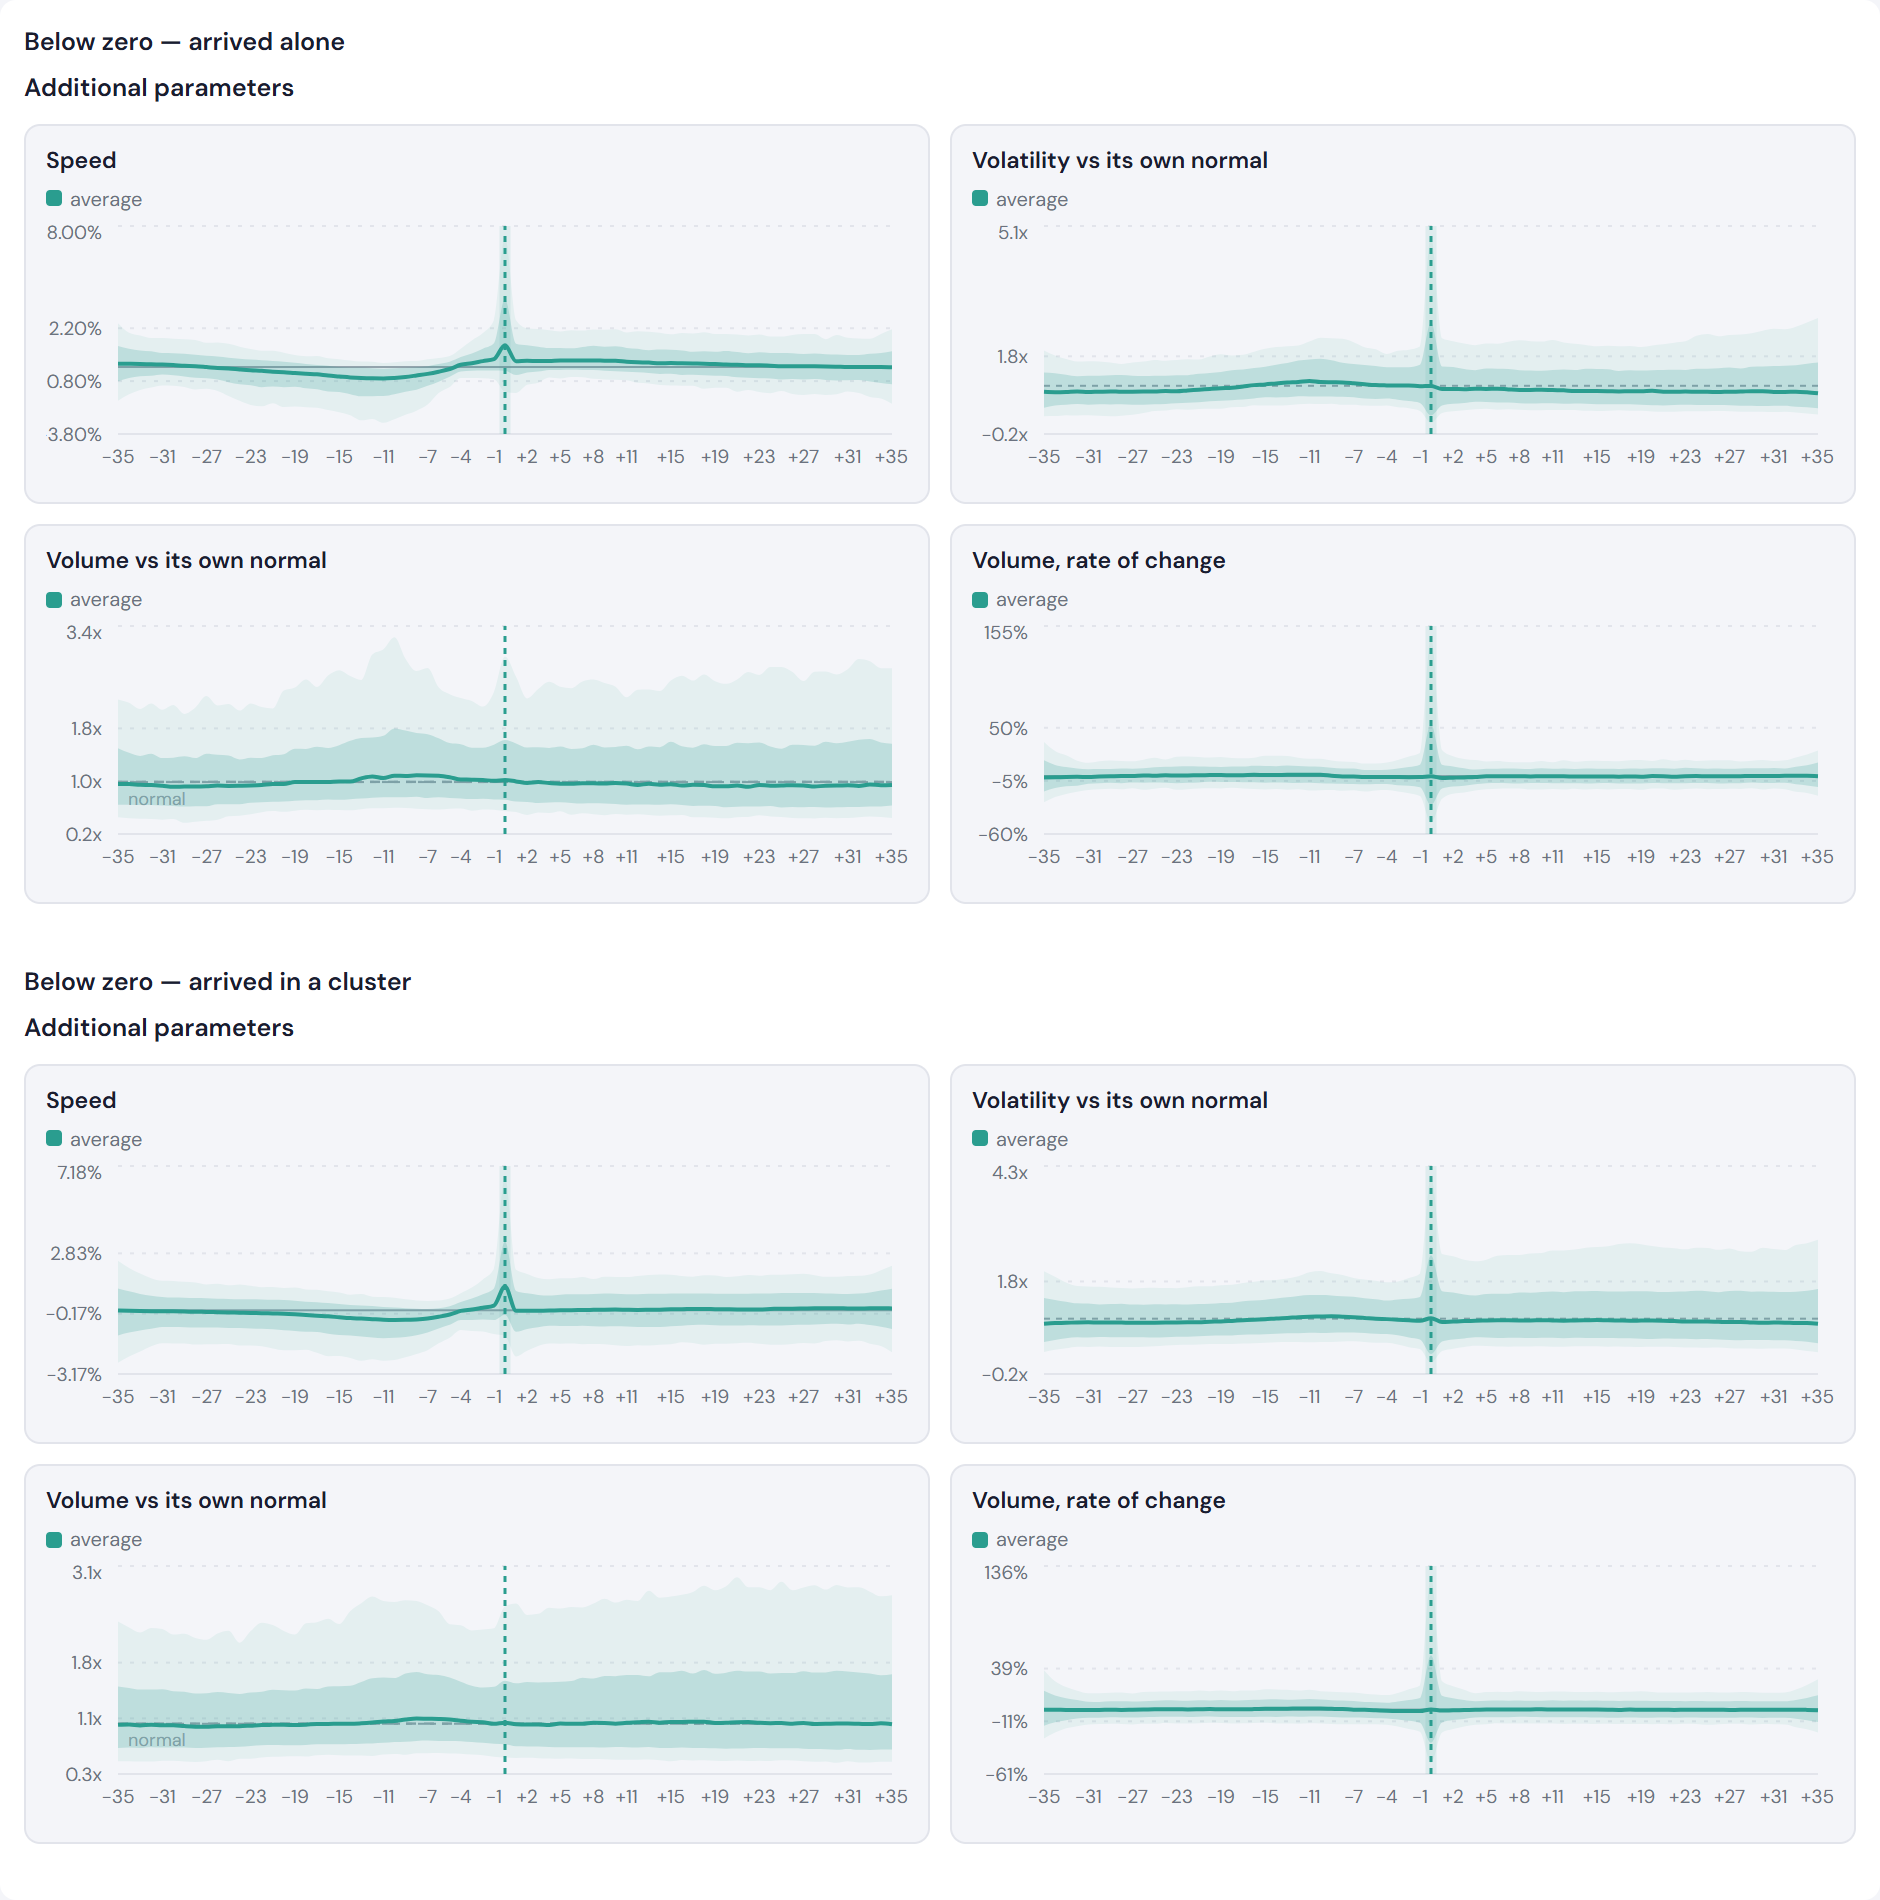
On the engine's own mean figures the same pattern holds: volume on the event day runs at 1.20× for the isolated group against 1.15× for the clustered one, and volatility over the following 35 days divided by the 35 before falls to 0.89 against 1.00. Those gaps rest on the same forward-looking split.
Whether volume adds information to a MACD crossover in real time is a separate question, and one this study cannot answer: it measured volume around the events but never used volume as a condition on them.
Conclusion
Across 197 US large-cap stocks, a bullish 12/26/9 MACD crossover was followed by a median 35-day return of 1.85%, against 1.94% after the comparison days. The crossover on its own did not show a clear incremental effect in this test.
Splitting the crossovers by zero-line position and by isolation produced a much larger difference. Isolated below-zero crossovers were followed by 7.62% against 0.78% for the clustered ones.
That difference does not hold up. Stratifying by the prior move leaves the gap almost unchanged. The larger difference comes from the forward-looking part of the definition: the isolated label requires no further crossover in the 35 days after the event, while the half that could have been applied on the day contributes nothing. The volume difference between the groups behaves the same way.
The study's most striking number therefore comes from a group defined partly by what happened after the event. What remains is the first result: over 35 trading days, a bullish MACD crossover was followed by 1.85% against 1.94% for the comparison days, and splitting by zero-line position alone does not change that materially.
Limitations
- The isolated classification uses later information, and the study shows this is not a technicality. Separating the two halves of the definition puts the whole of the isolated result in the forward-looking half. Every isolated figure in this study describes events selected partly using information from the 35 days after the event.
- The forward-isolated test was added after the first results were seen. It was run to check a finding rather than specified in advance, which is the right order for a check on an unexpected result but is worth stating.
- Not a strategy backtest. No entry, exit, sizing, holding rule or transaction cost is simulated.
- Fixed parameters. MACD is held at 12 / 26 / 9. This study does not establish that those settings are the best ones, and does not test others.
- One horizon. The headline figure is 35 trading days, which the app derives from its default setting. The shape of the response at shorter and longer horizons is not shown here.
- Dependent observations. 15,698 events are not 15,698 independent observations: the same stock contributes many, and 35-day windows from crossovers a median of 23 days apart overlap.
- Universe and survivorship. The 197 stocks are a hand-curated list of today's US large caps projected backwards. Stocks that left the universe through delisting, failure or reduced size are not represented, so the sample does not represent the full population of stocks that existed during 2018–2026.
- Rising period. 2018–2026 was generally positive for US large caps, which is why the comparison days carry the same drift.
- Associations. Differences between groups are associations within this sample. The study does not separate the crossover from the price movement preceding it.
- Data. Two stocks were excluded before the run — one whose feed repeats a delisted company's last price, one whose ticker was reused by a different company — and one more had too little history. Three stocks are missing the same twelve trading days in mid-2026, which removes a small number of eligible windows in those stocks.
How to reproduce this
Every chart above is the app's own Event Analysis panel, rendered from this study's results. Build the same event across the same stocks, set the horizon to 35, then change the assumptions and run it yourself. Step-by-step walkthrough.
Rebuild the test
GU Analyser is where many of these tests are built and explored, and the same tools are open to you. Examine indicators, construct rules, compare results and test market ideas against historical data — with the drawdown, the time invested and the fees shown alongside the return — rather than taking a claim on trust.
Create a free account and run your own event studies → or learn what the MACD measures →