The Test Bench › Study 001
Do Donchian Channel Breakouts Actually Work?
Three breakout rules, 179 US stocks, eight years — measured against simply staying invested.
STUDY 001A brief summary of the results
Most Donchian breakout rules made money in our test. Few of them beat simply staying invested. Their clearest effect was on market exposure and drawdown.
What is a Donchian Channel?
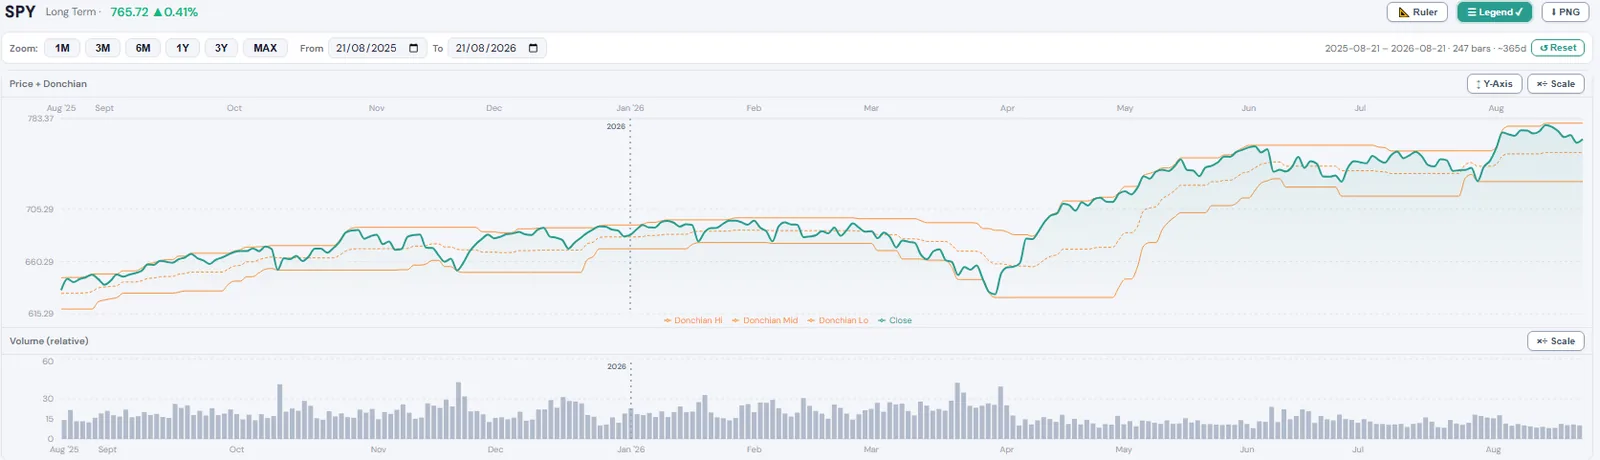
It draws two lines around the price: the highest price of the last N days, and the lowest. The band moves along as those high and low marks change.
That turns "the price is breaking out" into a rule you can test: buy when price reaches a high it has not touched in N days, sell when it drops to a low it has not touched in M days. The three rules below differ only in the size of N and M.
What the results show
We ran three ways of trading that channel across 179 US stocks over roughly eight years, and compared every result against a simple reference: buying once at the start and holding. Most of the rules made money. Very few beat the reference. What they changed most was how much of the time they were invested, and how far the account fell when prices dropped.
Six practical questions came out of the test. They're useful any time you look at a strategy.
These figures come from our own analysis. The three rules were built the same way and run across the same 179 stocks, over the same eight years, with the same costs. They differ only in how long a high must stand before the rule buys and how far price must fall before it sells — which is what the names mean: 20/20 buys at a 20-day high and sells at a 20-day low.
| Rule | Made money | Beat Buy & Hold |
|---|---|---|
| 20/20 | 112 / 179 | 14 / 179 |
| 20/10 | 74 / 179 | 8 / 179 |
| 55/20 | 101 / 179 | 17 / 179 |
The key lesson: making money and outperforming a simple benchmark are two different things.
That's the short version
You now have the main conclusions. The full study below shows how we reached them: the strategy rules, fees, the ADX test, drawdowns, market conditions, assumptions and limitations.
Read the full 179-stock study ↓
Full research: methodology, results and limitations
Every table, caveat and assumption behind the summary above
Study abstract. Across 179 US stocks from 11 April 2018 to 18 August 2026, all three Donchian rules lagged Buy & Hold substantially on median total return — under the classic 20/20 rule, 14 stocks out of 179 beat it. The same rules produced a smaller worst-case fall than Buy & Hold on most stocks, and spent between a fifth and two thirds of the time invested. In two shorter windows of falling prices we tested separately, they finished ahead of Buy & Hold on the majority of stocks.
In this test, their clearest effect was lower market exposure and smaller drawdowns rather than higher total return. Whether that is useful depends on which of those you were trying to achieve — and a single total-return figure cannot tell you.
Important. These are simplified historical simulations designed to test indicator rules. They are not recommendations, not advice, and not full reproductions of any historical trading system. Past performance does not indicate future results.
1. What a Donchian Channel is, in one minute
A Donchian Channel is a rolling price range: the upper line is the highest price over the last N days, the lower line is the lowest. It is a band drawn around the recent high-water and low-water marks, moving along with them.
That turns a vague instinct — "the price is breaking out" — into something you can actually test. A breakout rule says: buy when price reaches a level it has not touched in N days, and sell when it falls to a level it has not touched in M days.
2. The three rules we tested
All three use the same idea and differ only in how much history the entry needs, and how quickly the exit gives up. Changing the entry and exit lookbacks changes how often the rule trades, how long it stays invested, and how much it pays in fees.
| Rule | Buy when | Sell when | What changes |
|---|---|---|---|
| 20/20 | price reaches the previous 20-day high | price falls to the previous 20-day low | Donchian's original four-week rule. Symmetric. |
| 20/10 | price reaches the previous 20-day high | price falls to the previous 10-day low | Same entry, faster exit. Trades more, pays more in fees. |
| 55/20 | price reaches the previous 55-day high | price falls to the previous 20-day low | Much fussier entry. Waits for a bigger move and trades far less. |
A note on the Turtle Traders. 20/10 and 55/20 are the entry and exit shapes made famous by the Turtle experiment of 1983; 20/20 is Donchian's own rule and was never one of them. We tested only those entry and exit shapes. The actual Turtle systems also had position sizing based on volatility, stop losses, pyramiding into winners, short selling, and dozens of futures markets running at once. None of that is here, so this is not a verdict on the Turtle system — it is a test of one rule shape.
One technical detail matters here. The channel must be measured on the previous bar, not today's. Today's high is part of today's 20-day range, so asking "is today's price above the 20-day high?" is asking whether a number is above itself — it can never be true, and the backtest silently returns no trades at all. Every rule here compares today's price against yesterday's channel.
3. Test setup and assumptions
The assumptions below define the test. They were fixed and written down before we looked at any result.
| Item | Assumption |
|---|---|
| Timeframe | Daily bars only |
| Window | 11 April 2018 to 18 August 2026 |
| Universe | 179 US large-cap stocks with complete history over the window |
| Starting capital | $10,000 per test |
| Direction | Long only — no short selling |
| Position sizing | All available cash on entry, one position at a time, further buy signals ignored while already holding |
| Trading costs | 0.5% on every buy and 0.25% on every sell. These are deliberately conservative friction assumptions rather than a claim about what every investor would pay. Actual costs vary by broker, country, account setup, FX requirements and other factors. Both values are adjustable in GU Analyser, and later in this study we rerun the entire test with zero trading costs to see how much this assumption affects the conclusion |
| Execution price | The closing price of the day the signal fired |
| Open positions | Valued at the final price, and reported separately from completed trades |
| Idle cash | Earns no interest. A rule that is out of the market holds cash at 0%, which understates what a real account could have earned while waiting |
| Corporate actions | Historical open, high, low and close are all adjusted for stock splits and dividends, on the same basis; dividend adjustment treats distributions as reinvested. Share counts stay economically continuous through a split |
| Benchmark | Buy & Hold over exactly the same window, with the same fees |
Every setting in that table is a field in GU Analyser's backtester, so this test can be rebuilt rather than taken on trust — a step-by-step lesson walks through every screen. Use a custom date range of 11 April 2018 to 18 August 2026 — not the MAX button, which starts from a slightly different bar — with fees set to 0.5% and 0.25%. GU Analyser currently limits daily backtests to about ten years of history, so this exact window will eventually move out of range. Use the available dates to rerun the same rules and see whether the broad shape of the result holds. More generally, repeatedly changing a rule after seeing its historical results can overfit the past.
Splits and dividends. Open, high, low and close are all adjusted on the same basis, which matters here because a Donchian channel is built from highs and lows rather than closes. Dividends are treated as reinvested on the day they go ex, so these are total returns rather than price-only ones — though that reinvestment is assumed free, while our strategies pay 0.5% on every purchase.
Two assumptions deserve particular attention. First, the signal is intrabar — it fires the moment the price touches the channel during the day — but the trade is filled at that day's closing price. Those are different moments, and a real stop order would behave differently. Second, our universe is a list of companies that are large today, tested backwards. This is called survivorship bias: companies that collapsed or shrank out of the index are missing from the sample. This likely biases absolute historical returns upward, and may also affect the strategy-versus-benchmark comparison, though not necessarily in the same direction.
4. First result: profitable is not the same as better
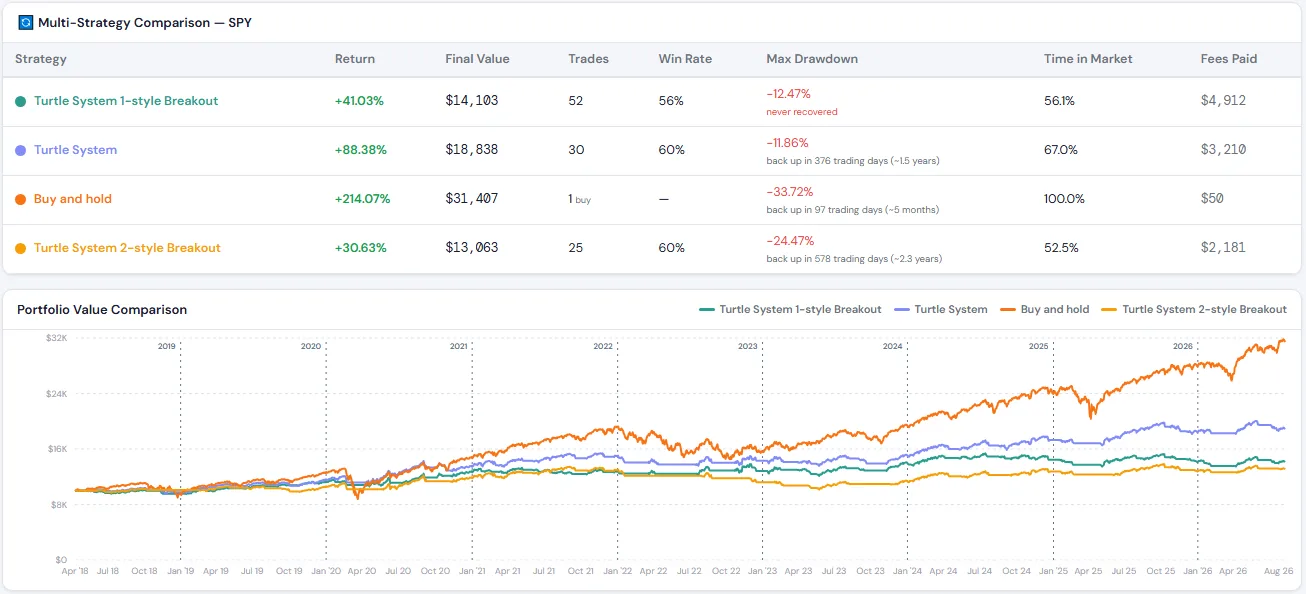
Take SPY, the S&P 500 ETF, on its own. All three rules made money. That looks like a success until the benchmark is added.
| SPY | Return | Trades | Win rate | Worst drawdown | Time invested | Fees paid |
|---|---|---|---|---|---|---|
| 20/20 | +88.38% | 30 | 60% | 11.86% | 67% | $3,210 |
| 20/10 | +41.03% | 52 | 56% | 12.47% | 56.1% | $4,912 |
| 55/20 | +30.63% | 25 | 60% | 24.47% | 52.5% | $2,181 |
| Buy & Hold | +209.24% | 1 buy | — | 33.14% | 100% | $49 |
Every rule was profitable. Every rule finished well behind simply buying once and holding.
And look at the fees column. The 20/10 rule paid $4,912 in transaction costs on an account that started at $10,000 — possible because each trade is charged on the position's value as the account grows, not on the original stake. Buy & Hold paid $49. That is the price of trading 52 times instead of once.
5. The same rules across 179 stocks
One stock proves nothing, so we ran all three rules across 179 US stocks. We report the distribution rather than the average — an average would let three spectacular results hide a hundred mediocre ones, so we show how the whole spread behaved.
"Typical" means the median — the middle stock when all eligible stocks are ranked on that measure, so half did better and half did worse. It is used in place of the mean throughout, for the reason just given.
| Rule | Beat Buy & Hold | Made money | Typical return | Typical gap vs Buy & Hold | Smaller worst drawdown than Buy & Hold |
|---|---|---|---|---|---|
| 20/20 | 14 of 179 | 112 of 179 | +13.8% | -107.3 pts | 119 of 179 |
| 20/10 | 8 of 179 | 74 of 179 | -8.8% | -129.9 pts | 125 of 179 |
| 55/20 | 17 of 179 | 101 of 179 | +6.5% | -121.5 pts | 144 of 179 |
| Buy & Hold | — | 160 of 179 | +122.9% | — | — |
Read the first two columns together, because the gap between them is the entire point. Under the classic 20/20 rule, 112 stocks made money and 14 beat Buy & Hold. Of the 112 profitable results, 100 still trailed Buy & Hold.
The scale is easier to feel with one example. On AMD, the 20/20 rule returned +1,999% — it multiplied the account twenty times over. Buy & Hold returned +4,807%. A backtest that turns $10,000 into $210,000 can still be the weaker result on total return.
Running one rule across many stocks is a single operation rather than 179 separate ones, which is what made this practical to check. Each stock gets its own price chart with every entry and exit marked and the result of each trade attached, so a number in the table can be traced back to the trades that produced it.
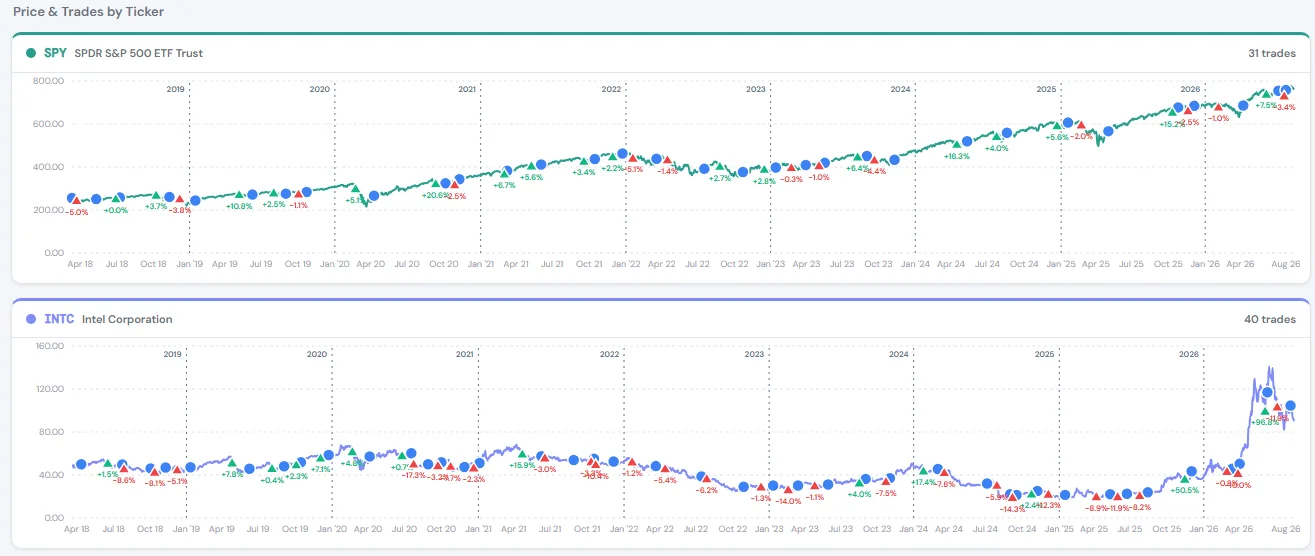
Rebuild this one yourself: the 20/20 rule on SPY, 11 April 2018 to 18 August 2026, is a few minutes of setup in GU Analyser.
Is this just the fees?
Fees are large enough here to be worth challenging, so we re-ran the identical study with zero trading costs — a zero-cost sensitivity check used to isolate how much the assumed trading friction affected the result.
| Rule | Beat Buy & Hold, with fees | Beat Buy & Hold, zero fees | Made money, with fees | Made money, zero fees |
|---|---|---|---|---|
| 20/20 | 14 of 179 | 25 of 179 | 112 of 179 | 136 of 179 |
| 20/10 | 8 of 179 | 22 of 179 | 74 of 179 | 126 of 179 |
| 55/20 | 17 of 179 | 23 of 179 | 101 of 179 | 126 of 179 |
Removing fees changed the numbers, but not the broad conclusion. Even with no trading costs at all, 154 of 179 stocks still did better under Buy & Hold than under the classic 20/20 rule. Removing the fees roughly doubles the number that beat it — from 14 to 25 — and leaves the typical gap at 74.4 percentage points rather than 107.3. The rules lag because of what they do, not because of what we charged them.
But the two questions separate sharply. For the high-turnover 20/10 rule, fees decide whether it made money at all — 74 stocks profitable with costs, 126 without. They move the benchmark comparison far less: 8 versus 22 out of 179 — nearly three times as many, and still a small minority. Fees decided whether these rules made money. They did not decide whether the rules beat the reference.
6. Win rate told us very little
Win rate is the share of trades that finished in profit, and it is the number quoted most often. Across our 179 stocks, the correlation between win rate and total return was 0.36 — a weak positive relationship. Win rate alone told us surprisingly little about total strategy return in this sample.
Tesla under the 20/20 rule won 37.9% of its trades and returned +744%. Two trades in three lost money, and the rule still finished up sevenfold, because the winners were larger than the losers. This is a single example, and it shows that a low win rate can still produce a strong result.
7. What happens when we add an ADX filter?
A natural hypothesis is that breakouts fail when there is no real trend behind them. To test it, we added one condition to the entry and changed nothing else: ADX(14) above 25, measured on the previous bar. ADX is a trend-strength gauge: it tries to say whether price is moving in a direction or just milling about, without saying which direction.
| Rule | ADX improved return | ADX reduced return | Typical change | Best case | Worst case | Reduced worst drawdown |
|---|---|---|---|---|---|---|
| 20/20 | 41.3% | 58.7% | −9.0 pts | +134 pts | −1,694 pts | 81.6% |
| 20/10 | 44.1% | 55.3% | −3.9 pts | +81 pts | −761 pts | 84.9% |
| 55/20 | 43% | 56.4% | −3.9 pts | +94 pts | −435 pts | 80.4% |
Percentages may not sum to 100% because on a small number of stocks the filter changed nothing at all.
ADX changed several parts of the strategy differently. It raised the return on roughly four stocks in ten and lowered it on roughly six, with a very wide spread between the best and worst cases. On one stock it added 134 percentage points; on another it removed 1,694.
The measured changes were consistent: fewer trades, 16 to 27 percentage points less time invested, and a smaller worst drawdown on around eight stocks in ten. Its most consistent effect was lower activity, lower market exposure and smaller drawdowns, rather than higher return.
8. Drawdown, and how long recovery took
Maximum drawdown is the largest peak-to-trough fall the account suffered along the way — the worst it ever felt, measured from the best it had ever been. It adds information that total return alone does not show, and it can help show how difficult a strategy would have been to hold through.
On drawdown the rules did clearly better. 171 of 179 stocks had a smaller worst drawdown under 55/20+ADX than under Buy & Hold: a typical 31.4% against 52.2%. Lower exposure — 22.6% of the time invested against 100% — is likely an important contributor, though when a rule is out of the market matters as well as how often.
How we measure recovery, and why the comparison is limited. Recovery time is the number of trading days from the lowest point of the worst drawdown until the account first closes at or above its previous peak. If it never gets back there before the test ends, the value is recorded as not recovered rather than as a number.
That makes a simple median misleading, so we are not quoting one. Buy & Hold recovered its worst drawdown on 120 of 179 stocks. The rules recovered on far fewer — 55/20+ADX on 57, 20/20 on 62 — because a rule that exits and sits in cash has a flat equity curve, and a flat curve cannot climb back to a previous high. Comparing the average of those two very different groups would compare different sets of stocks.
To compare recovery times directly, we restrict the comparison to stocks where both recovered. On that basis the picture is mixed rather than one-sided:
| Rule | Stocks where both recovered | Rule's typical recovery | Buy & Hold's typical recovery | Rule recovered sooner |
|---|---|---|---|---|
| 55/20 + ADX | 47 of 179 | 171 days | 302 days | 29 of 47 |
| 55/20 | 53 of 179 | 236 days | 315 days | 30 of 53 |
| 20/20 | 58 of 179 | 316 days | 287 days | 25 of 58 — slower more often than not |
So the filtered 55/20 rule did tend to recover sooner where a comparison is possible, while plain 20/20 recovered later than Buy & Hold more often than it recovered sooner. On every rule, most stocks are excluded from this table entirely because one side or the other never recovered within the test. We would not draw a general conclusion about recovery speed from this.
9. Does the result depend on the market? Three windows suggest it does
April 2018 to August 2026 was a strong period for US equities. A long-only rule that sits in cash part of the time faces a strong headwind against Buy & Hold in that environment, so the headline result is partly a property of the window rather than of the indicator.
Rather than leave that as a caveat, we re-ran the identical rules on three shorter windows with different characters. The same four rules are shown for all three windows, and the windows were chosen before any of these results were seen — Q4 2018 and 2022 as the two clearest declines in the period, and 2020 as the one sharp crash followed by a fast recovery. The sample size differs between windows (181, 186 and 197) for a simple reason: a shorter window needs less history, so stocks excluded from the eight-year table qualify for it.
| Window | Rule | Beat Buy & Hold | Typical gap | Typical return | Worst drawdown | Time invested |
|---|---|---|---|---|---|---|
| Q4 2018 sharp selloff n=181 | 20/20 | 64.1% | +3.35 pts | −7.14% | 9.2% | 30.2% |
| 20/10 | 65.2% | +5.12 pts | −6.71% | 8.1% | 19.1% | |
| 55/20 | 76.2% | +9.97 pts | 0.00% | 0% | 0% | |
| 55/20 + ADX | 81.8% | +12.40 pts | 0.00% | 0% | 0% | |
| Buy & Hold | — | — | −13.38% | 20.6% | 100% | |
| 2022 sustained decline n=197 | 20/20 | 59.9% | +4.67 pts | −12.01% | 25% | 42.2% |
| 20/10 | 68% | +8.85 pts | −8.14% | 20.8% | 31.5% | |
| 55/20 | 58.4% | +7.08 pts | −9.43% | 16.7% | 19.5% | |
| 55/20 + ADX | 66.5% | +13.01 pts | −3.52% | 8.8% | 8.4% | |
| Buy & Hold | — | — | −18.73% | 35.3% | 100% | |
| 2020 crash, fast recovery n=186 | 20/20 | 56.5% | +1.47 pts | +6.21% | 18.3% | 58.2% |
| 20/10 | 44.1% | −2.42 pts | +0.18% | 17.1% | 43.5% | |
| 55/20 | 43% | −2.65 pts | −2.23% | 14.6% | 37.1% | |
| 55/20 + ADX | 41.9% | −5.74 pts | 0.00% | 6.9% | 10.2% | |
| Buy & Hold | — | — | +3.85% | 37.8% | 100% |
In the two declines the rules finished ahead of Buy & Hold on most stocks. In the 2020 crash-and-rebound they did not — a rule that steps aside during a fall also misses the recovery, and in 2020 the recovery was unusually fast. The more a rule reduced exposure, the better it did in 2018 and 2022 and the worse it did in 2020, which is consistent across all four rules.
Two qualifications matter when interpreting these windows. First, in Q4 2018 the 55/20 rules show 0% time invested: they did not trade at all. They finished ahead of the benchmark by sitting out the fall entirely, which is a different thing from trading it well. Second, three short windows cannot support a general claim about bear markets. One quarter and two single years is a handful of episodes, too few to carry a general claim. What this shows is what happened in these specific windows, and a mechanism — less exposure — that is at least consistent across them.
10. What the study showed
- Profitable is not the same as better. 112 of 179 backtests made money under 20/20; 14 beat simply staying invested.
- The two questions can point in opposite directions. Over eight years the rules were often profitable and usually behind the benchmark. In Q4 2018 the filtered 55/20 rule was profitable on very few stocks and ahead of the benchmark on most of them.
- Win rate told us little. Correlation with total return was 0.36. Tesla won 37.9% of its trades and returned +744%.
- Fees are part of the strategy. $4,912 against $49 on the same stock, the same period, the same starting capital.
- Adding an indicator changes the strategy; improvement has to be measured. The same ADX filter raised returns on four stocks in ten and lowered them on six, with a worst case of −1,694 points.
- What varied most consistently was exposure. These rules were invested between 22.6% and 56.4% of the time, and most of their differences from Buy & Hold — lower returns in a rising market, smaller drawdowns, better relative results in the two declines — appear closely related to that difference in exposure.
11. Limitations
- Survivorship bias. The universe is companies that are large today, tested backwards. This likely biases absolute historical returns upward and may affect the comparison against the benchmark too.
- One market, one timeframe, one rule shape. US large-cap stocks, daily bars, long only. Nothing here generalises to other markets, timeframes, or short selling.
- Simplified execution. All-in position sizing, one position at a time, no stops, filled at the closing price of the signal day. A real implementation differs in every one of those, and the intrabar signal with a closing fill is an approximation.
- Recovery times are only partly measurable — on most stocks one side or the other never recovered within the test window, so that comparison rests on a minority of the sample.
- 21 of the 200 stocks we ran had less than the full eight years of data — some listed later, and for some our data provider holds a shorter history. They are not in the main table, so every stock there covers identical dates.
- Three regime windows is a small number of episodes, and they are not independent of the main window.
- A backtest is not a forecast. Historical performance is evidence about the past, not proof that a rule will continue to work.
Background and sources
Historical background. The notes on Richard Donchian and the Turtle experiment are background context drawn from the sources below. Richard Donchian's four-week rule and his role in early trend following are widely documented, as is the 1983 Turtle experiment run by Richard Dennis and William Eckhardt — the common accounts are Curtis Faith's Way of the Turtle (2007), written by one of the original participants, and Michael Covel's The Complete TurtleTrader (2007). Everything else on this page — every number, table and figure — comes from our own runs, and the method is stated above so it can be checked.
Using this research. The analysis, tables and figures on this page are GU Analyser Ltd's own work, published under a Creative Commons BY-NC 4.0 licence: quote it, cite it and build on it with credit to GU Analyser. Not for commercial use.
Verdict
In this sample, Donchian breakout rules were frequently profitable and mostly finished behind staying invested on total return. They also produced a smaller worst drawdown on the large majority of stocks, and finished ahead of the benchmark on most stocks in the two declining windows we tested.
Whether that counts as "working" depends entirely on which question you are asking. Measured on total return over these eight years, no. Measured on the size of the worst fall, mostly yes. Measured over a falling market, in these two windows, mostly yes. Measured on recovery speed, the evidence here is too incomplete to say. Those are four different answers from one set of runs, and a single headline number reports only the first.
Rebuild the test
GU Analyser is where many of these tests are built and explored, and the same tools are open to you. Examine indicators, construct rules, compare results and test market ideas against historical data — with the drawdown, the time invested and the fees shown alongside the return — rather than taking a claim on trust.
Create a free account and test your own strategies → or learn what a Donchian Channel measures →