Does the Bullish Engulfing Pattern Work? A Weekly Test
Across 480 current S&P 500 companies, the weekly bullish engulfing underperformed ordinary weeks by 0.80 percentage points over the next 12 weeks.
The Test Bench › Candlestick patterns
An engulfing pattern is two candles where the body of the second completely covers the body of the first.
We tested 17,734 weekly bullish and 18,209 weekly bearish engulfing patterns across 480 current S&P 500 companies from 2007 to 2026.
The bullish version underperformed ordinary weeks by 0.80 percentage points over the next 12 weeks. The bearish version showed almost no difference from ordinary weeks.
Here is the exact definition we used and how the tests were run.
Each candle covers one period of the chart: five minutes on a 5-minute chart, one session on a daily chart, one week on a weekly chart. The same shapes can form on any of them.
An engulfing pattern is two candles of opposite colour where the body of the second candle covers the body of the first.
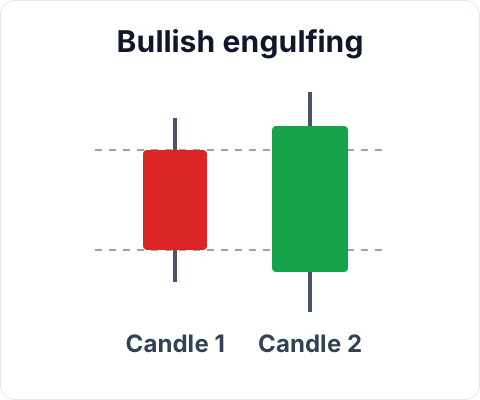
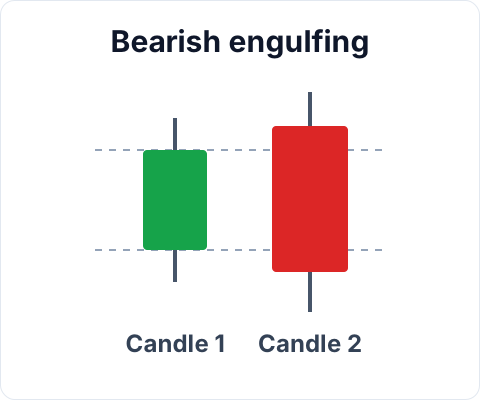
In both, at least one of the second candle's open and close must lie strictly beyond the first body; two bodies that are exactly equal do not count. The wicks are ignored, and a candle whose close equals its open counts as an up candle.
Full methodology and results for the weekly tests: Does the Bullish Engulfing Pattern Work? A Weekly Test and Does the Bearish Engulfing Pattern Work? A Weekly Test.
The detection looks at the two candles only. The traditional reading adds the trend before them: a bullish engulfing after a decline, a bearish engulfing after an advance, each read as a possible change of direction.
A weekly candle opens at Monday's open, closes at Friday's close, and takes the highest high and lowest low of the week. A weekly engulfing therefore compares one full week with the next. The second candle is complete only after the last session of its week has closed, so a weekly pattern is known at the end of the week, not during it.
Weekly candles summarise more trading in each candle than daily ones and produce fewer patterns over the same years.
GU Analyser also marks the doji, hammer and hanging man, inverted hammer and shooting star, harami, piercing line and dark cloud cover, morning and evening star, three white soldiers and three black crows, and the marubozu. Each can be tested the same way, and new studies will be added to this page.
A pattern is an event: it occurs on a particular candle. An event study measures what happened after each occurrence and compares it with what happened after ordinary candles in the same stocks.
If a pattern tends to occur more often in certain market conditions, the comparison can be restricted to ordinary candles from those same conditions. This separates the pattern from the general behaviour of the market state around it.
An event study is not a trading-strategy backtest. It does not simulate entries, exits, stops, position sizing or trading costs. It describes what happened in the historical sample under the stated rules.
Across 480 current S&P 500 companies, the weekly bullish engulfing underperformed ordinary weeks by 0.80 percentage points over the next 12 weeks.
Across 480 current S&P 500 companies, the weekly bearish engulfing showed almost no difference from ordinary weeks.
A two-candle pattern: a down candle followed by an up candle whose body covers it. The first candle closes below its open. The second opens at or below the first candle’s close and closes at or above the first candle’s open, so its body covers the whole body of the first. It is traditionally read as a sign that a falling price may turn up.
The mirror image: an up candle followed by a down candle whose body covers it. The first candle closes above its open. The second opens at or above the first candle’s close and closes at or below the first candle’s open. It is traditionally read as a sign that a rising price may turn down.
Not in the definition used here. Only the bodies are compared: the open and the close of each candle. Some traders also ask the second candle to cover the first candle’s wicks (sometimes called an outside bar), which is a stricter rule that finds fewer patterns.
In our weekly test on 480 current S&P 500 companies (2007 to 2026), the median 12-week return was 0.80 percentage points lower than after ordinary weeks. The full study gives the intervals, the four market states and the traditional setup.
In the same test, after a bearish engulfing the median 12-week return showed no clear difference from ordinary weeks. The full study gives the intervals, the four market states and the traditional setup.
The detector does not require a prior trend: it looks at the two candles only. The traditional interpretation places a bullish engulfing after a decline and a bearish engulfing after an advance. Individual studies may test that context separately.
They are opposites. In an engulfing pattern the second body covers the first. In a harami the second body sits inside the first.
Any. A candle can summarise five minutes, a day or a week, and the same shapes form on each. A weekly candle summarises five trading sessions, so a weekly engulfing compares one full week with the next.
Yes. In GU Analyser the Candles menu marks the patterns on a chart, and the same patterns can be used in a strategy or in an event study on the canvas.
Run the same weekly test yourself on any stocks
Build the engulfing event on weekly candles (Premium, with your own Tiingo key), choose your stocks, and compare what followed the pattern with ordinary weeks in the same market conditions. Any other detected pattern works the same way.
Create a free account and run your own event studies → or read how an event study works →The method: how an event study works