Does the Opening Range Breakout Actually Work?
One 15-minute opening range breakout rule on 149 large US stocks over six months of 5-minute candles: the result per trade, as a portfolio, at four trading costs, and its strongest and weakest stocks.
The Test Bench › Opening range breakout
An opening range breakout (ORB) is a day-trading setup that uses the high and low of the first part of the trading session as reference levels. A trader then watches for price to break above the high or below the low.
There is no single set of ORB trading rules. The opening range is a framework: traders choose the range length, the entry trigger, the stop, the targets and any filters. This page explains the framework, walks through a real example and links our tests of specific ORB rules.
The opening range is the high and low formed during a chosen period after the market opens. For US stocks, a common choice is the first 15 minutes, from 09:30 to 09:45 New York time. It gives four levels:
Common lengths are 5, 15 and 30 minutes. A longer opening range has more time to establish a wider high-to-low range. If the range is wider, price has farther to travel to break it, and a stop on the opposite side is also farther from the entry.
In GU Analyser the Opening Range is an indicator that draws these four levels — how it is calculated.
Once the opening range is complete, the trader waits for a breakout. A bullish ORB buys above the ORB High. A bearish ORB sells short below the ORB Low. The entry trigger decides when a breakout counts:
A common stop sits on the opposite side of the range. Targets are often multiples of the range, or of the amount risked.
A simple example: the 15-minute range runs from $100 to $101, so the range is $1. A bullish ORB buys above $101. A stop on the other side of the range sits at $100, and a target of one range sits at $102.
Each of these choices changes the trades a rule takes, so each ORB rule needs its own test.
SPY, the S&P 500 ETF, on 28 September 2026, in GU Analyser.
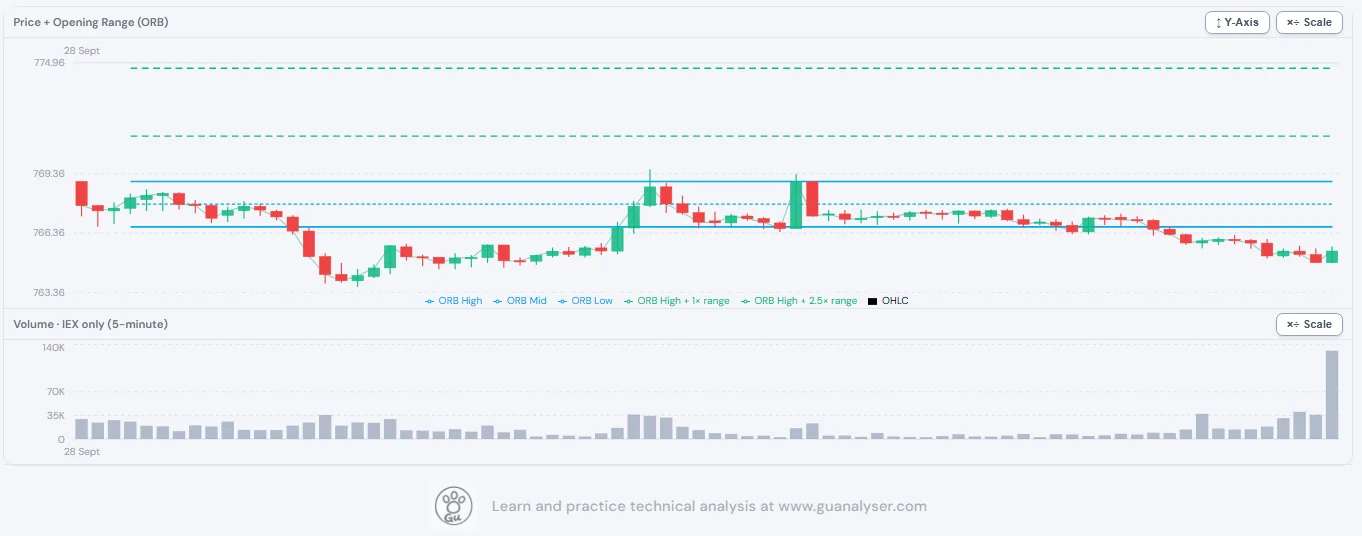
The same session gives different outcomes under different entry rules: a breakdown for a bearish rule, two failed touch breakouts, or no trade under candle-close confirmation. A single trading day cannot establish whether a rule works. A backtest measures the rule across the full sample.
An ORB rule states each of these parts:
An ORB rule reads the exact high and low of a few short candles. Price feeds build those candles from different sets of trades: a single exchange, a group of exchanges, or the consolidated tape, each with its own filters. The same five minutes can have a different high or low on two platforms, and a rule that needs a candle to clear the range by a few cents can enter on a different candle.
Rules on short candles, such as 5-minute, 15-minute and hourly, can be moved by the few trades that set a candle's high or low. No feed shows the price an order would have filled at: a real order pays the spread and reaches the market after a delay. A rule whose backtested average trade is close to zero can change size or sign with the data source. Study 007 runs the same ORB rule on SPY in GU Analyser and on another well-known trading platform.
Each study specifies the trading rule, the data, the execution assumptions and the trading costs. The results show what happened in the tested sample, and each study states what the test cannot establish.
One 15-minute opening range breakout rule on 149 large US stocks over six months of 5-minute candles: the result per trade, as a portfolio, at four trading costs, and its strongest and weakest stocks.
Gap and go tested on 149 US stocks over six months: ORB trades on gap-up, flat and gap-down days, and whether the breakout added anything to the gap.
One ORB rule on SPY run on two platforms’ 5-minute data: why backtest results change with the price feed, and how to separate the rule from the data.
Another intraday rule tested on 5-minute candles, on the same stocks: the VWAP and Anchored VWAP studies.
A day-trading setup that marks the high and low of the first minutes of the session, the opening range, and trades a move beyond it. A bullish ORB buys above the range high. A bearish ORB sells short below the range low. The entry trigger, the stop and the targets differ from one ORB rule to another.
An ORB whose range is the high and low of the first 15 minutes of trading, 09:30 to 09:45 New York time for US stocks. On 5-minute candles that is the first three candles. Study 005 tests one 15-minute rule.
Common choices are 5, 15 and 30 minutes. A shorter range completes sooner and can produce more breakout signals. A longer range takes longer to form and is usually wider.
The result depends on the ORB rule, the stocks, the period and the trading costs. Study 005 tests one 15-minute rule on 149 large US stocks over six months. That rule produced a negative average trade after an assumed trading cost. Other ORB rules need to be tested separately.
Commonly on the opposite side of the range, or at its midpoint. After a first profit target, some rules move the stop on the rest of the position to the entry price, known as breakeven.
Multiples of the opening range beyond the breakout, such as one range and two and a half ranges above the ORB High; multiples of the amount risked (R); or a fixed percentage. Many rules also close any open position before the end of the day.
A variant that trades the breakout only on days that open with a price gap, in the direction of the gap. A gap is the difference between the day’s first price and the previous day’s last price. In Study 006, the 15-minute breakout averaged +0.033% a trade after an assumed cost on gap-up days and -0.110% on flat days, over six months of 5-minute candles.
Trading costs can matter because ORB strategies may trade frequently. In Study 005, the tested rule’s average trade was small enough that changing the assumed round-trip cost had a noticeable effect on the result. The study reports the same trades at four cost assumptions.
Platforms build 5-minute candles from different price feeds: a single exchange, a group of exchanges or the consolidated tape, each with its own filters. An ORB rule reads the exact high and low of a few short candles, so a few cents on one candle can move the entry. In Study 007, the same ORB rule on SPY returned -1.77% in GU Analyser and -0.33% on another well-known trading platform over the same three months.
Yes. In GU Analyser you build the rule on a visual canvas — the opening range, the entry, a partial exit, a breakeven stop and an end-of-day exit — and backtest it on 5-minute candles with your own data key.
Want to test a different ORB rule?
Build the opening range, entry trigger, stop, targets and exits on the strategy canvas, then backtest the rule on 5-minute candles with your own data key and your own cost assumption.
Create a free account and build your own strategies → or read how the Opening Range is calculated →The method: how a backtest is built