The Test Bench › MACD studies › Study 004
Do Sharper MACD Crossovers Lead to Better Returns?
We tested whether stronger bullish MACD crossovers were followed by larger moves over the next 35 trading days.
STUDY 004The short version
We looked at 8,520 bullish MACD crossovers that happened below the zero line across 198 US large-cap stocks. Simple question: when the crossover was sharper, did the stock tend to move more over the next 35 trading days?
Sharpness here is the one-day change in the MACD histogram, divided by the share price. That puts a $10 stock and a $700 stock on the same scale.
Sharper crossovers had higher median returns: +3.33% against +2.45% for all of them, and +1.86% for a matched ordinary trading day. They also had bigger losses, with the worst 5% of outcomes moving from -16.67% to -21.19%. The filter picked out larger moves in both directions, partly by keeping more crossovers from volatile markets (82% of what was left, against 60% before).
One clean test fixed the threshold on the first half of the data and applied it once to the second half. Sharper crossovers came out 1.30pp ahead, with a 95% interval of 0.17pp to 2.74pp.
The averages hide a split. In a rising, calm market, sharper crossovers that arrived alone did better (+6.56% to +8.52%). The same filter on clustered crossovers did worse (-0.97% to -4.66%).
That pattern came from the same data that suggested it, so it needs testing on fresh data before it says anything about the next crossover.
This study follows Study 003, and uses the same stocks, period and 35-day measure. The full set is on the MACD studies page.
This looks at what happened in past data. It is not advice and does not predict future returns.
Full research: method, results and limitations
Every table and assumption behind the summary above
What we tested
The question. Do sharper bullish MACD crossovers below the zero line lead to larger 35-day returns?
We started with 8,520 such crossovers across 198 US large-cap stocks and compared the outcomes at different sharpness thresholds.
What is a bullish MACD crossover?
The MACD line and its signal line move around each other. A bullish crossover is the day the MACD line rises through its signal line.
What does below zero mean?
The MACD zero line is where the two moving averages behind the MACD are level. A crossover below zero happens while the MACD is still under that line, which usually follows a decline. This study looks only at those crossovers, because Study 003 measured them as the stronger half.
What makes one crossover sharper than another?
The MACD histogram is the distance between the MACD line and its signal line. At a bullish crossover it passes through zero. Some crossovers barely move through it; others move much further on the same day.
This study uses that one-day move as its measure of sharpness, divided by the closing share price:
Sharpness = one-day change in the MACD histogram ÷ closing share price
The histogram is measured in the same units as the price, so without that division a single threshold would sort the stocks by share price. Dividing puts every stock on the same relative scale. Across the 8,520 crossovers the median sharpness is 0.194% of the share price in one day; taking each stock's own median first gives 0.195%, so the pooled figure is not driven by whichever stocks fire most often.
The sharpness is always positive at a bullish crossover, because the histogram moves from zero or below to above zero at every one of them. A threshold on it sorts crossovers by size.
Single and clustered crossovers
Some crossovers happen on their own. Others come in runs. We call a crossover single when no other crossover in the same stock falls within 35 days either side of it, and clustered when at least one does. The two behaved very differently, which is where this study ends up.
Whether a crossover turns out to be single can only be known 35 days later, because the definition looks forward as well as back. Study 002 measured this split and found its advantage produced by that definition. It describes the sample and is not a rule anyone could have followed at the time.
Why test this filter?
Study 003 raised the question of whether the strength of a crossover could separate stronger and weaker outcomes. Because the idea came from those results, most of this page is exploratory, and the test described later is the more controlled one.
Two different comparisons
The page makes two comparisons and they answer different questions. The second is this study's subject.
- Crossover against ordinary day. Does a below-zero MACD crossover behave differently from a normal trading day in the same market?
- Sharper crossover against ordinary crossover. Does the sharpness add anything beyond the crossover itself?
Adding a condition to an event reduces the crossovers and leaves the pool of ordinary days untouched, so the second comparison is the one that isolates the filter. A figure that shows only the first credits the filter with the crossover's own effect.
Method
- Events. Bullish MACD signal-line crossovers occurring below the zero line, MACD 12 / 26 / 9, on daily bars.
- Universe. 198 US large-cap stocks, the same screens as Studies 002 and 003.
- Window. Fixed, ending 2026-09-03.
- Horizon. 35 trading days, unchanged from the earlier studies and fixed before this question was asked.
- Thresholds. Points on the distribution above, chosen from event counts alone before any return was read.
- Comparison. Each group of crossovers is measured against ordinary trading days carrying the same two labels: price above or below its 200-day average, and volatility above or below that stock's own median for the period. These are the same four market states Study 003 used, with the same definitions and the same event counts. Other differences between the groups remain.
- Engine. The same event-study code the application runs, with the filter written as a rule the engine evaluates.
A condition added to an event rule reduces the events and leaves the pool of ordinary days untouched. Results here are therefore read against all below-zero crossovers as well as against ordinary days: the crossover was already +0.59pp ahead of an ordinary day before any filter existed, and a comparison that ignores that credits the filter with it.
The largest difference appeared in one market state
The four market states of Study 003 were each measured at every threshold, for crossovers that arrived alone and for those that arrived in a cluster. The condition moves the result in one of them: a rising, calm market, price above its 200-day average and volatility below that stock's own median. The other three are within 1.2pp either way and are not shown.
What the groups looked like before any filter
In that state, an ordinary trading day returned +1.32% over 35 days and a below-zero crossover +1.48%. Splitting those crossovers by whether another followed within 35 days separates them far more than the crossover itself does.
| Group | Events | Median after 35 days | Against comparison days | 95% interval |
|---|---|---|---|---|
| Ordinary trading days | 145,069 | +1.32% | — | — |
| All crossovers | 1,723 | +1.48% | 0.16pp | — |
| Arrived alone, no filter | 498 | +6.56% | 5.24pp | 4.09pp to 6.24pp |
| Arrived alone, past the threshold | 99 | +8.52% | 7.20pp | 4.67pp to 10.87pp |
| In a cluster, no filter | 1,218 | -0.97% | -2.28pp | -3.29pp to -1.20pp |
| In a cluster, past the threshold | 144 | -4.66% | -5.98pp | -10.41pp to -1.82pp |
All four groups were separated from ordinary trading days in this comparison. Single crossovers sat above those days and clustered crossovers sat below them, and the sharpness filter widened the gap on both sides.
That is the first of the two comparisons. To judge the filter itself we need the second one: sharper crossovers against ordinary crossovers.
Those intervals compare each group with ordinary days. On the second comparison the intervals overlap for both groups: the results point the same way, and the uncertainty around the filtered-versus-unfiltered difference is still too wide to establish its size.
Adding the sharpness filter
Each panel holds the same crossovers with and without the condition, at 0.277% of the share price in one bar. The solid line is the median price measured from the crossover; the dashed edges hold the middle 75% of episodes.
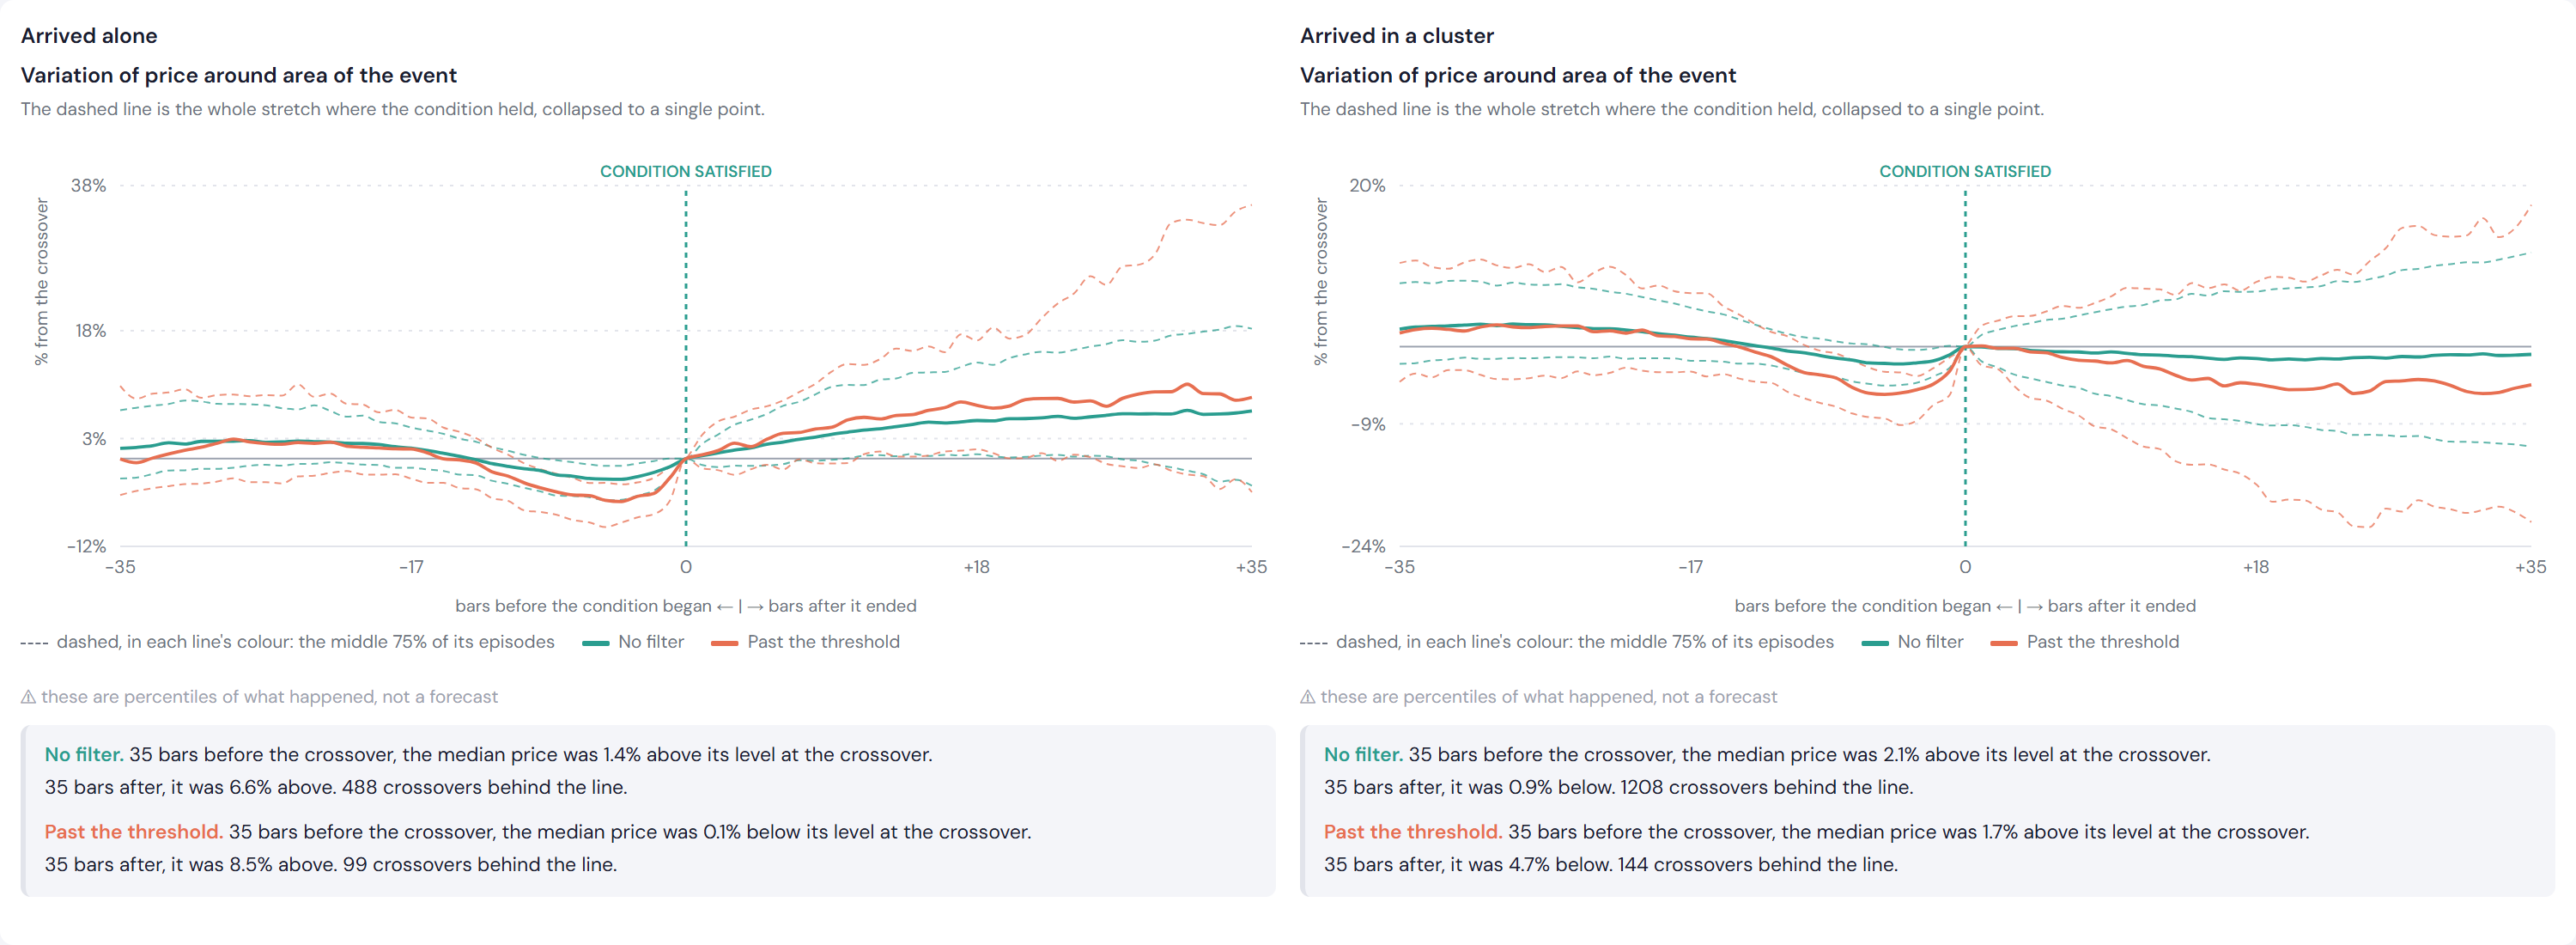
The condition moves the two cohorts in opposite directions. Crossovers that arrived alone went from +6.56% to +8.52%, a gain of 1.96pp. Crossovers that arrived in a cluster went from -0.97% to -4.66%, a fall of 3.70pp.
Both filtered groups rest on a few hundred events, and the bands are wide. The filter keeps 99 of the 498 crossovers that arrived alone and 144 of the 1,218 that arrived in a cluster. Both panels rest on a few hundred events or fewer, and the dashed bands are wide against the gap between the lines.
The individual outcomes
The same two groups drawn as individual outcomes, at 9, 18, 26 and 35 days. This shows how far apart the outcomes were; the chart above shows where the middle of them ended up.
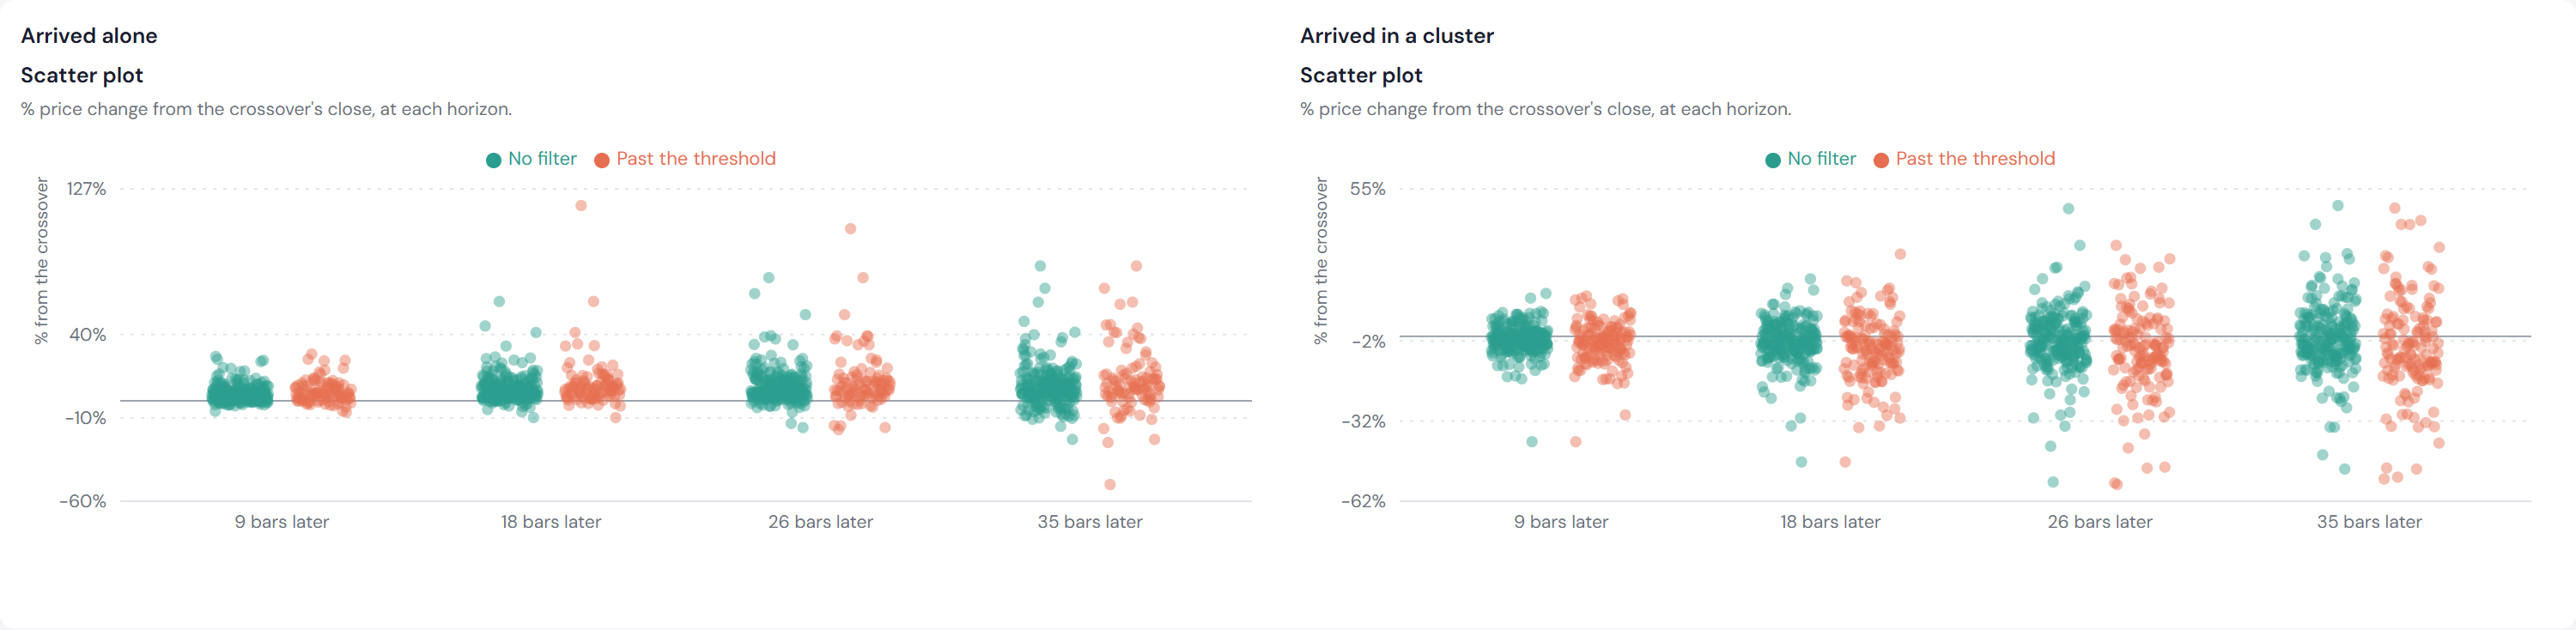
The number of dots is capped so that a larger group does not visually overwhelm a smaller one. Read the range and shape of the outcomes; the event counts are in the table above.
The outcomes spread wider with the condition in both panels, at every horizon. Read with the medians above, the condition selects larger moves in both directions, and the direction it lands on differs between the two groups.
The frozen holdout test
Most of this page is exploratory, because the filter was motivated by Study 003. We therefore fixed the threshold, the statistic, the interval method and the success criterion using the first half of the study period, then applied that rule once to the second half.
The threshold was 0.200%, the median sharpness in the first period. Support was defined in advance as a positive difference whose 95% interval excluded zero. Both were written down and committed to version control before the second period was read.
This is a holdout test, and not a preregistered study. The idea of testing crossover sharpness came from Study 003's results. What was fixed in advance is the rule used to evaluate it on the second period.
It also answers a different question from the section above. This test pools every market state and both cohorts; the finding above is that pooling hides two effects pointing opposite ways. The two are consistent, and neither supports the other: a pooled difference cannot say which cohort produced it, and that is exactly what the cohort panels examine.
- Definition period. 2018-04-24 to 2022-06-29, 3,891 crossovers. The threshold is their median scaled change: 0.200%.
- Test period. 2022-06-29 to 2026-09-03, 4,629 crossovers, read once.
- Statistic. The median 35-day return of crossovers at or above the threshold, minus that of crossovers below it. The two groups share no events.
- Interval. Calendar-block bootstrap, 49-day blocks, 2,000 replicates.
| Group | Events | Median | Share ending higher |
|---|---|---|---|
| At or above 0.200% | 2,104 | +3.59% | 61.4% |
| Below 0.200% | 2,404 | +2.29% | 58.2% |
In the test period the medians were +3.59% above the threshold and +2.29% below it, a difference of 1.30pp. The 95% interval runs from 0.17pp to 2.74pp, so zero sits outside it.
That is evidence of a difference in this holdout period. It does not establish that the effect will repeat in future data, and it does not make 0.200% an optimal threshold — that number is the first period's median, chosen because a median needs no tuning.
Measured across the whole period instead, no threshold produced a difference whose interval excluded zero. The frozen test splits the period in two and compares sharper crossovers with the rest directly, which rests on a larger sample than any single market state can offer.
Things that could affect these findings
- The filter was exploratory. The idea came from Study 003, so most of this analysis uses the same data that suggested it. The frozen holdout test is the exception.
- The market state was selected after the fact. The detailed figures show the one of four states where the filter produced the largest change. The other three moved by less than 1.2pp either way.
- Some groups are small. The filtered groups hold a few hundred events or fewer, so their medians move substantially when individual observations change.
- The size of the previous decline is not controlled for. Sharper crossovers followed deeper falls, so part of what follows could be recovery from a larger prior decline.
- The volatility label uses information from the full period. Each stock's volatility median was calculated over the whole study window, including days after the crossover.
- The test covers one market and one set of MACD settings. 198 US large-cap stocks, one window ending 2026-09-03, MACD 12 / 26 / 9, daily bars.
- Trading costs are excluded. These are event outcomes. They do not model entry and exit costs, slippage or position sizing.
- These results describe the stocks and period tested here. They do not tell us what the next MACD crossover will return.
What the study showed
In a rising, calm market the sharpness filter separated single and clustered crossovers in different directions.
- Single crossovers: +8.52% after filtering, against +6.56% without it.
- Clustered crossovers: -4.66% after filtering, against -0.97% without it.
In both cases the filtered group had larger moves. The difference was positive for single crossovers and negative for clustered ones.
The filter appears to select for larger moves. Whether those moves go up or down seems to depend on whether the crossover stood alone.
Each of the four groups was separated from ordinary trading days. The step from unfiltered to filtered is smaller, and its uncertainty interval is still too wide to establish the size of the filter's own effect.
That interpretation rests on one market state and a few hundred events in each group, over one period.
The frozen holdout test returned a difference of +1.30pp, interval +0.17pp to +2.74pp. It excludes zero. That is a single result on a single period, and it is the only claim here that was not chosen after seeing the data.
What should we test next?
These results raise a more specific question: does crossover sharpness behave differently when the crossover occurs on its own, compared with when several occur close together?
That question came from looking at this data, in the same way this filter came from looking at Study 003's. Answering it means fixing the rule on one period and reading another once, as the frozen holdout test above does. It would show whether the pattern survives when the data that suggested it are kept separate from the data used to judge it.
The methods above are reproducible in the application: the scaled rate of change is a derived signal built from the MACD histogram and the closing price, and the filter is a condition added to the crossover rule.
Rebuild the test
Reproduce the analysis: create a bullish MACD crossover event, add the condition that it occurs below zero, calculate the one-day MACD histogram change and scale it by the closing share price. Apply different thresholds and compare the resulting groups.
Create a free account and run your own event studies → or read Study 003, which this follows →